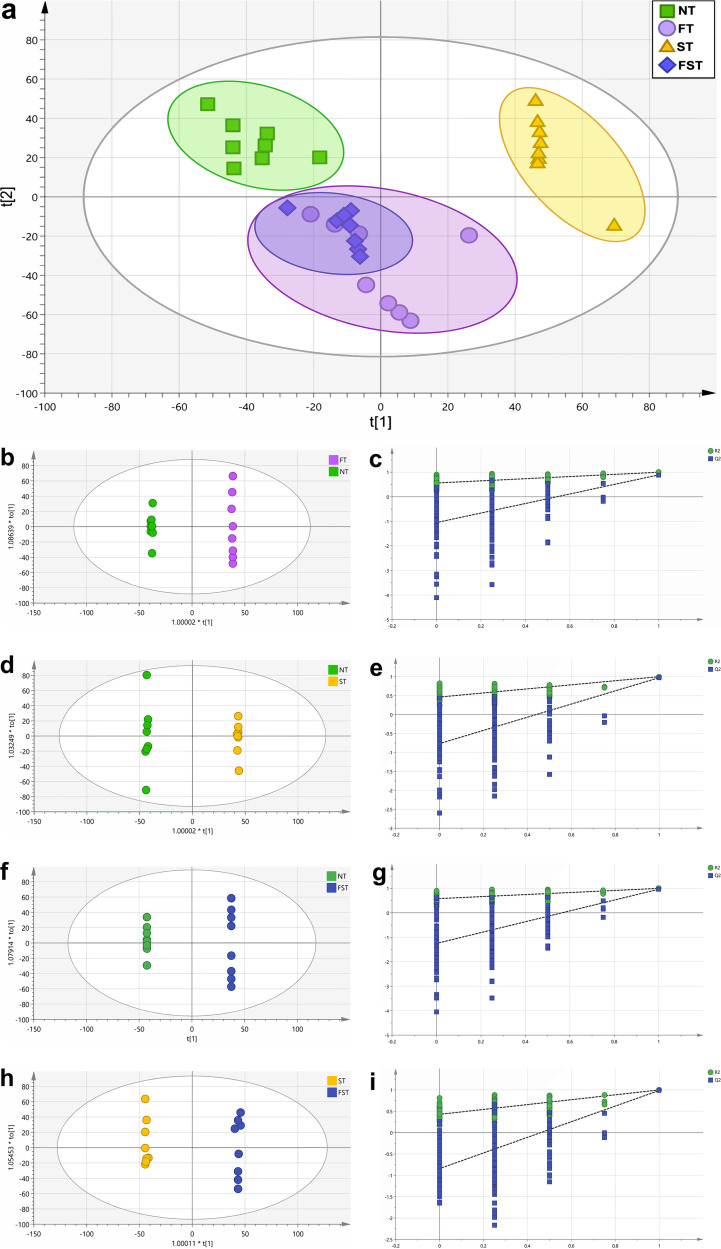
FIG 7.
PCoA and OPLS-DA plots of cecal metabolomes at 3 dpi. (a) PCoA plot of cecal metabolomes. OPLS-DA score plots of cecal metabolites were based on LC-MS from the different groups. (b, d, f, and h) OPLS-DA plots of four data sets: the FT group versus the NT group (b), the ST group versus the NT group (d), the FST group versus the NT group (f), and the FST group versus the ST group (h). (c, e, g, and i) Validation plots of OPLS-DA data for these four group sets.

