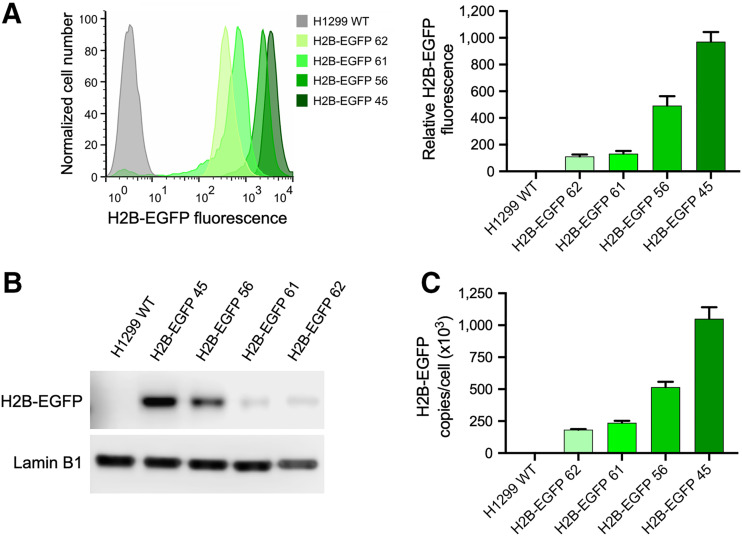
FIGURE 1.
Establishment of H1299 cell lines stably transfected with H2B-EGFP. (A) Relative difference in H2B-EGFP expression across all transfected cell lines, determined by flow cytometry and presented as batch-normalized bar chart. (B) Confirmation of difference in H2B-EGFP expression across transfected cell lines using Western blot. (C) Copy number per cell of H2B-EGFP in each transfected cell line, quantified by ELISA.

