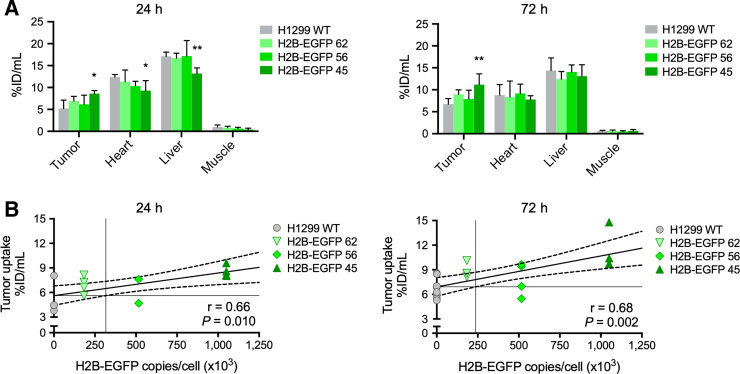
FIGURE 6.
Image quantification analysis of 111In-GFP-G1-TAT biodistribution in vivo. (A) Image quantification analysis showing uptake of 111In-GFP-G1-TAT in selected tissues, 24 and 72 h after intravenous administration. (B) Correlation of quantified tumor uptake with expression of H2B-EGFP, 24 and 72 h after intravenous administration. Asterisks denote statistically significant differences in uptake from H1299 WT group. *P < 0.05. **P < 0.01. ***P < 0.001.

