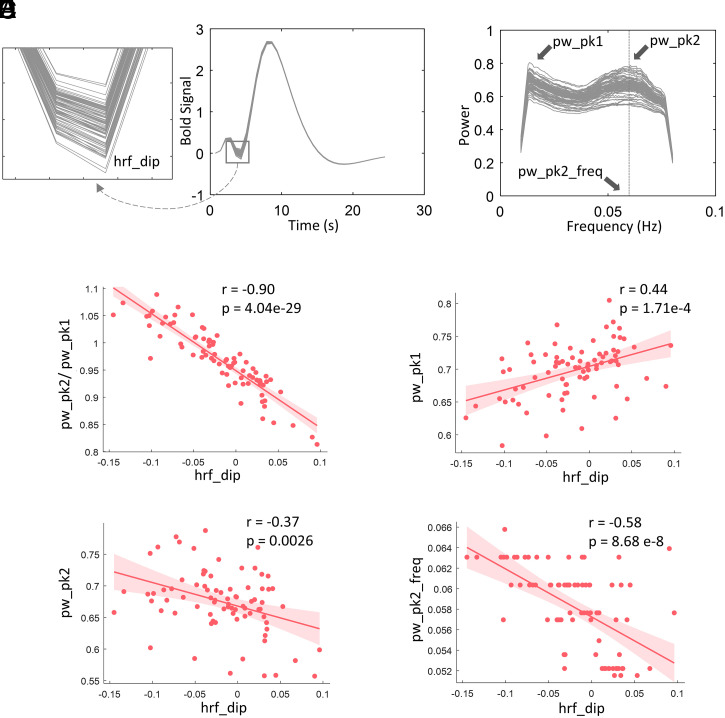
Fig. 2.
The relationship between HRFs and power spectral in DP voxels across 80 WM ICs. (A) Estimated HRFs of 80 WM ICs. (B) Power spectra of 80 WM ICs. (C) Correlation between the dips of HRFs and the ratio the two peaks in power spectra across 80 WM ICs. (D) Correlation between the dips of HRFs and the magnitudes of first peaks in power spectra across 80 WM ICs. (E) Correlation between the dips of HRFs and the magnitudes of second peaks in power spectra across 80 WM ICs. (F) Correlation between the dips of HRFs and the coordinates of second peaks on frequency band across 80 WM ICs. The solid lines and shaded areas plot the linear fits of the data with associated CI (95%). The P values were corrected for multiple comparison using Bonferroni method.

