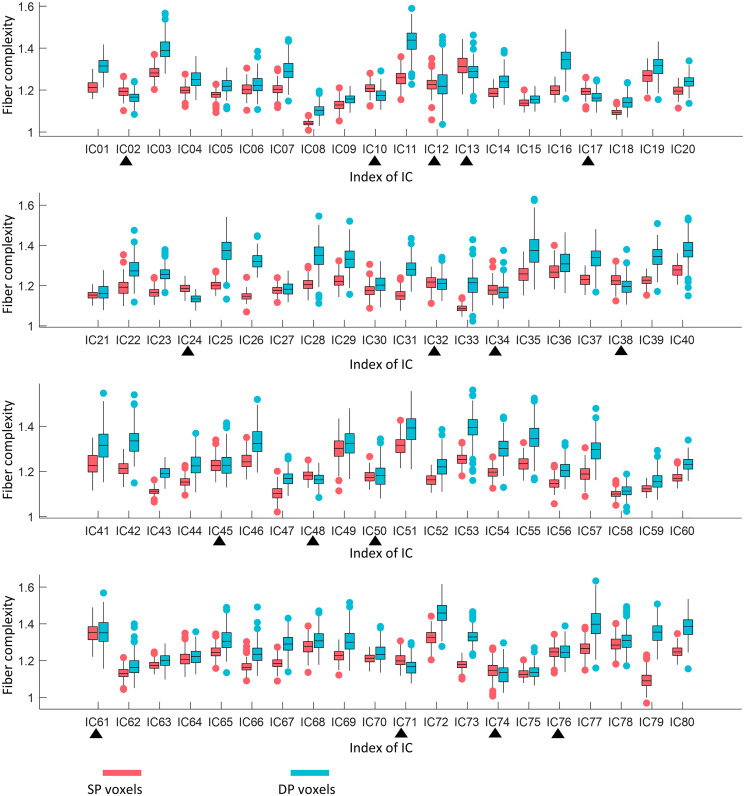
Fig. 3.
Comparison of fiber complexity between SP and DP areas in 80 WM ICs. A total of 64 out of 80 ICs show significantly higher fiber complexity in DP area than in SP area. Black triangles indicate nonsignificant (paired-sample t test, P > 0.05, Bonferroni corrected) differences or higher complexity in the SP area. Each box plots the median (center line), the first quartile (lower boundary), and third quartile (upper boundary) of the data. The red and blue scatters indicate the outliers.

