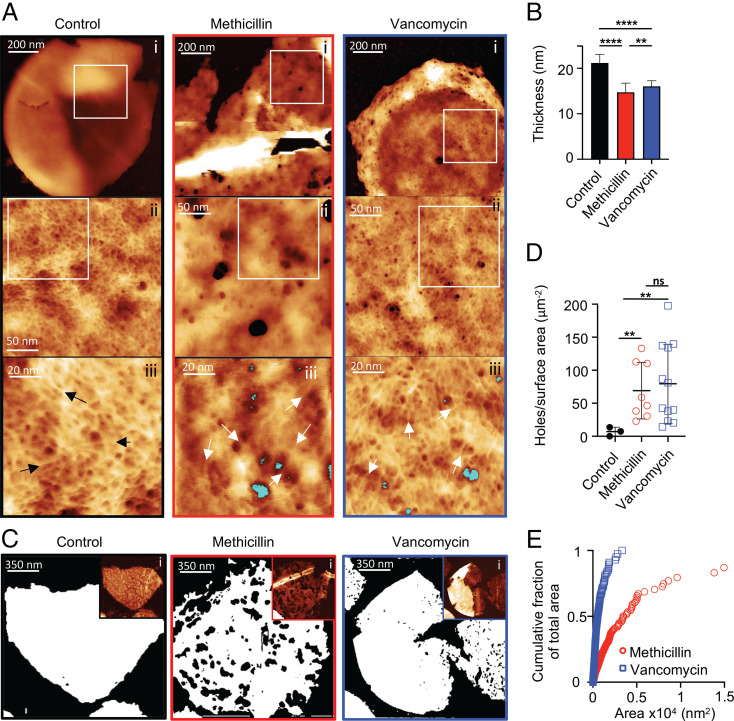
Fig. 3.
The effect of cell wall antibiotics on PG architecture. (A) AFM images of the internal surface of isolated sacculi after 60 min treatment of cells with antibiotics. From left to right columns, black panels are the control (SH1000), red panels are methicillin-treated SH1000, and blue panels are vancomycin-treated SH1000. (i) In all of the columns, height channel of individual sacculi with the internal surface facing upwards, data scales (DS) = 202, 82, and 24 nm. In control, the zoomed image from the squared white area marked in i (ii), showing the internal coarse architecture displaying a smooth surface, DS = 13 nm; in methicillin and vancomycin, internal coarse architecture displaying a surface perforated by some holes that span all the way on the cell wall (ii), DS = 41 and 15 nm. In control, the zoomed image from the squared white area marked in ii (iii), showing the finer internal architecture, which consists of a randomly oriented glycan fibrous mesh (see black arrows) with small pores between the fibers, DS = 12 nm; in methicillin and vancomycin, randomly oriented glycan fibrous mesh (see white arrows) with small pores between the fibers next to some of the perforating holes (marked in blue) (iii), DS = 10 and 16 nm. (B) The mean height of individual sacculi in air measured by AFM after 60 min treatment of antibiotics; error bars show SD; for all samples, n = 28. After t test, P (control − methicillin, ****) = 2.364 × 10⁻¹⁷, P (control − vancomycin, ****) = 5.323 × 10⁻¹⁷, and P (methicillin − vancomycin, **) = 4.816 × 10⁻³. (C) Binary images using the threshold technique (SI Appendix, Fig. S7) where white = PG, black = background, the black areas inside the white sacculi correspond to holes spanning the cell wall. (i) Insets are the following: AFM topography images in which the binary image analysis was performed; DS = 51, 92, and 104 nm. (D) Holes per surface area of sacculus (micrometer squared), sample size n = 3, 8, and 12 from left to right; black lines represent mean value and SD. After t test with Welch's correction: p (control − methicillin, **) = 4.3 × 10⁻³, P (control − vancomycin, **) = 1.5 × 10⁻³, and P (methicillin − vancomycin, not significant [ns]) = 0.65. (E) Cumulative fraction of total area plotting individual perforating holes: vancomycin, n = 899 and methicillin, n = 678. For sample size and data reproducibility, see Materials and Methods.

