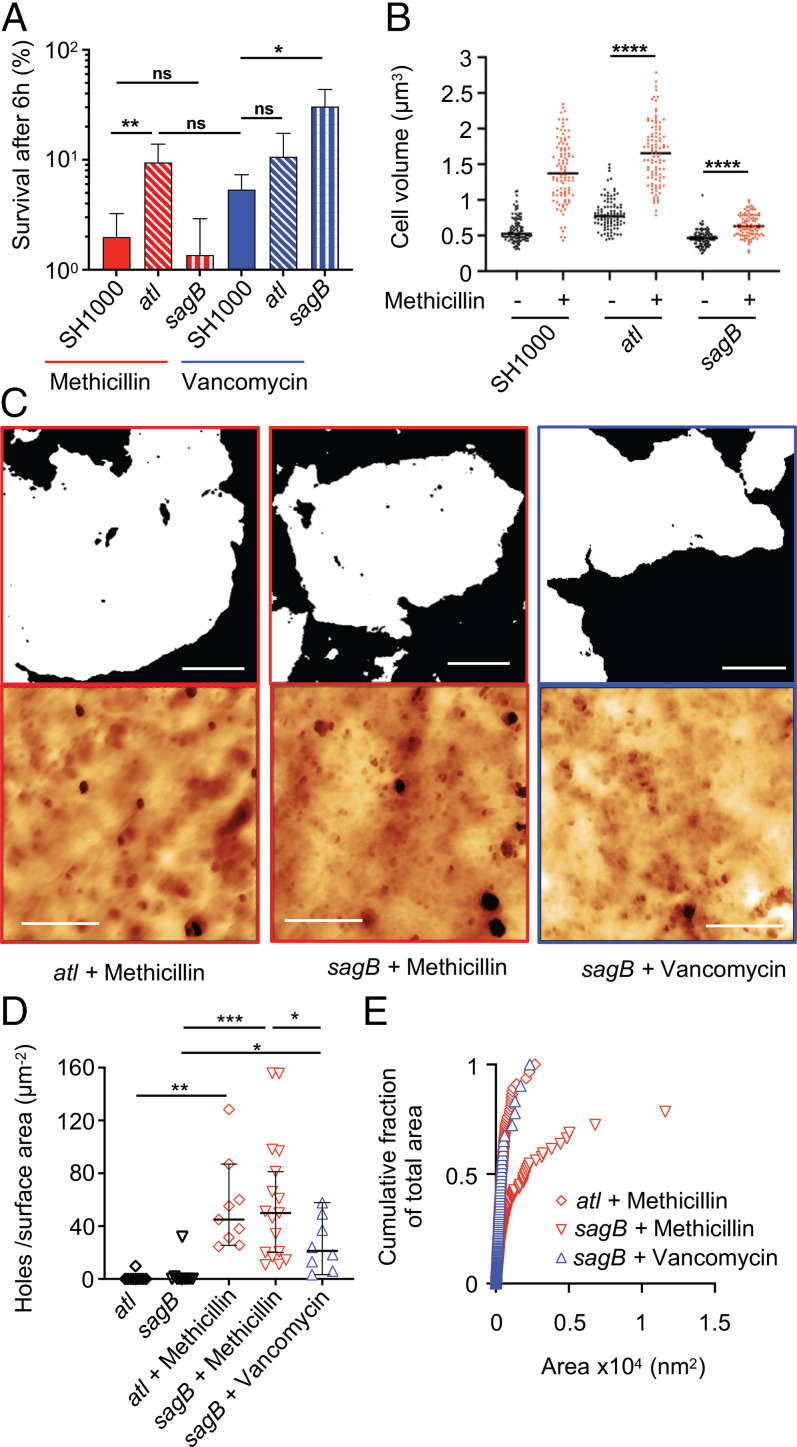
Fig. 4.
Differential role of PGH in the action of cell wall antibiotics. (A) Deletion of atl and sagB increases S. aureus survival in the presence of specific antibiotics, 6 h treatment. After t test with Welch's correction, P (SH1000 + methicilin − atl + methicillin, **) = 7.7 × 10⁻³, P (SH1000 + methicilin − sagB + methicillin, ns) = 0.1930, P (atl + methicilin − SH1000 + vancomycin, ns) = 0.0737, P (SH1000 + vancomycin − atl + vancomycin, ns) = 0.1158, and P (SH1000 + vancomycin − sagB + vancomycin, *) = 0.0158. (B) Effect of methicillin treatment (60 min) on cell volume as measured by SIM after NHS-ester AlexaFluor 555 labeling. After t test with Welch's correction, P (atl − atl + methicillin, ****) = 2.305 × 10−37, and P (sagB − sagB + methicillin, ****) = 7.685 × 10⁻¹⁷. (C) AFM images of purified sacculi are the following: top row, binary threshold where white = PG, black = background (scale bars, 250 nm); bottom row, height channel of internal sacculus architecture of sagB and atl mutants after 10 × MIC methicillin or vancomycin treatment for 60 min (scale bars, 100 nm), data scale (DS) from left to right = 40, 40, and 30 nm. (D) Holes per surface area (micrometer squared), sample size n = 8, 12, and 12 from left to right. Black lines represent mean value and bars represent SD for strains treated with antibiotics for 60 min. After t test with Welch's correction, P (atl − atl + methicillin, **) = 1.349 × 10⁻³, P (sagB − sagB + methicillin, ***) = 1.753 × 10⁻⁴, P (sagB − sagB + vancomycin, *) = 1.546 × 10⁻², and P (sagB + methicillin − sagB + vancomycin, *) = 2.4 × 10⁻², when compared to SH1000 strain: P (SH1000 + methicillin − atl + methicillin, ns) = 0.47, P (SH1000 + methicillin − sagB + methicillin, ns) = 0.57, and P (SH1000 + vancomycin − sagB + vancomycin, *) = 1.24 × 10⁻². (E) Cumulative fraction of total area plotting individual perforating holes: atl, n = 408; sagB + methicillin, n = 488; and sagB + vancomycin, n = 122.

