. 2021 Oct 26;12(45):15067–15076. doi: 10.1039/d1sc05089c

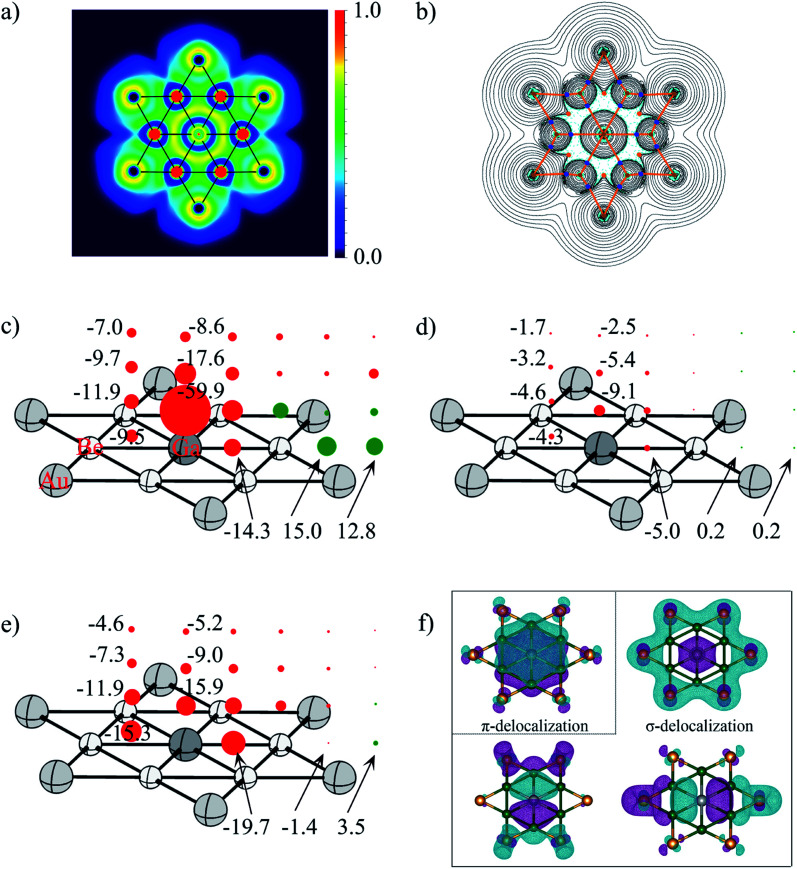
Fig. 6. (a) Electron localization function (ELF) and (b) the contour plot of the Laplacian distribution of electron density, ∇2ρ(r) including bond critical points and bond paths of phGa, where cyan dashed lines indicate areas of charge concentration (∇2ρ(r) < 0) and solid black lines show areas of charge depletion (∇2ρ(r) > 0). The solid orange lines connecting the atomic nuclei are the bond paths. Blue dots are bond critical points (BCPs), and orange dots are ring critical points (RCPs); (c) NICSzz, (d) NICSπzz, (e) NICSσzz (σ-delocalization) and (f) the shape of π-delocalized CMO and three σ-delocalized CMOs of the D6h GaBe6Au6+ at the PBE0/def2-TZVP level (the values in the left column refer to the center of the Be–Ge–Be triangle). Diatropic and paratropic tensors are shown in red and green, respectively. NICS values are in ppm.

Fig. 6