. 2015 Aug 15;85(3):374–380. doi: 10.2319/050914-334.1

Figure 1.

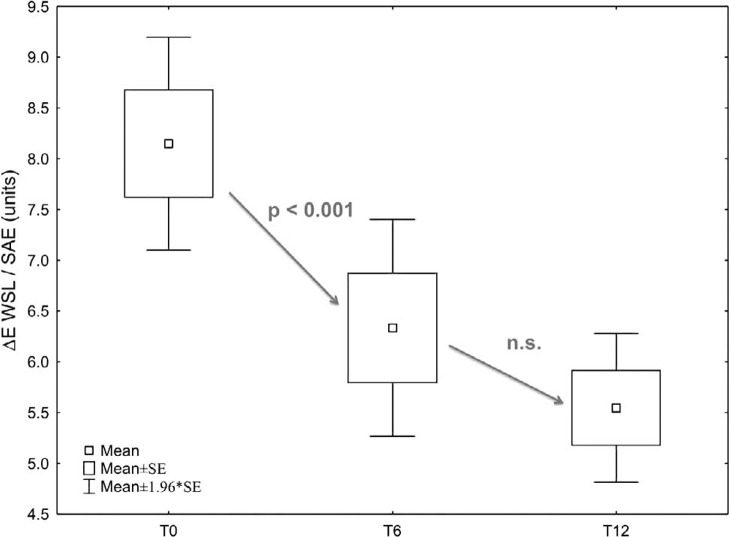
Figure 1. Color difference between white-spot lesions (WSLs) and sound adjacent enamel (SAE) at various assessment time points.The t-tests detected highly significant differences for summarized color and lightness values (ΔE CIE-L*a*b* b) of the WSL vs SAE areas between baseline measurements and measures taken 6 months (T6) or 12 months (T12) after infiltration. A further reduction of ΔE values between T6 and T12 was not found to be significant.

Color difference between white-spot lesions (WSLs) and sound adjacent enamel (SAE) at various assessment time points.The t-tests detected highly significant differences for summarized color and lightness values (ΔE CIE-L*a*b* b) of the WSL vs SAE areas between baseline measurements and measures taken 6 months (T6) or 12 months (T12) after infiltration. A further reduction of ΔE values between T6 and T12 was not found to be significant.