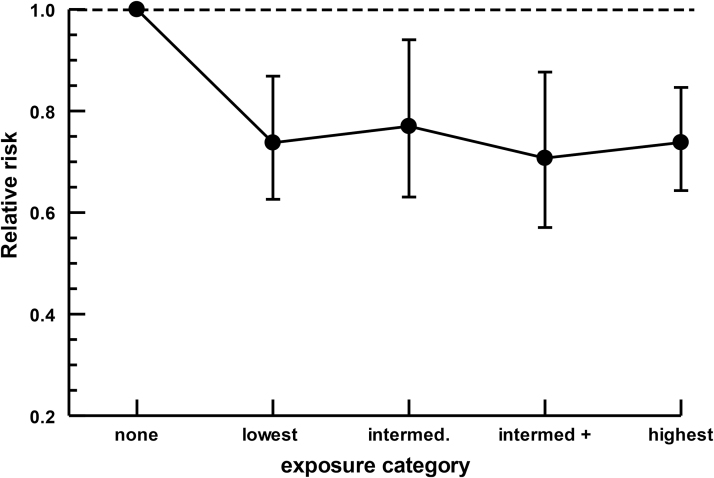
FIG. 8.
Analysis of potential exposure-dependence. Data from a subset of studies could be assigned to arbitrary exposure categories. Results are expressed as mean RR ±95% CI. Cancer types, and exposure units placed into each category, are presented in Table 5. All exposure categories are significantly different to nonusers but not different to each other.

