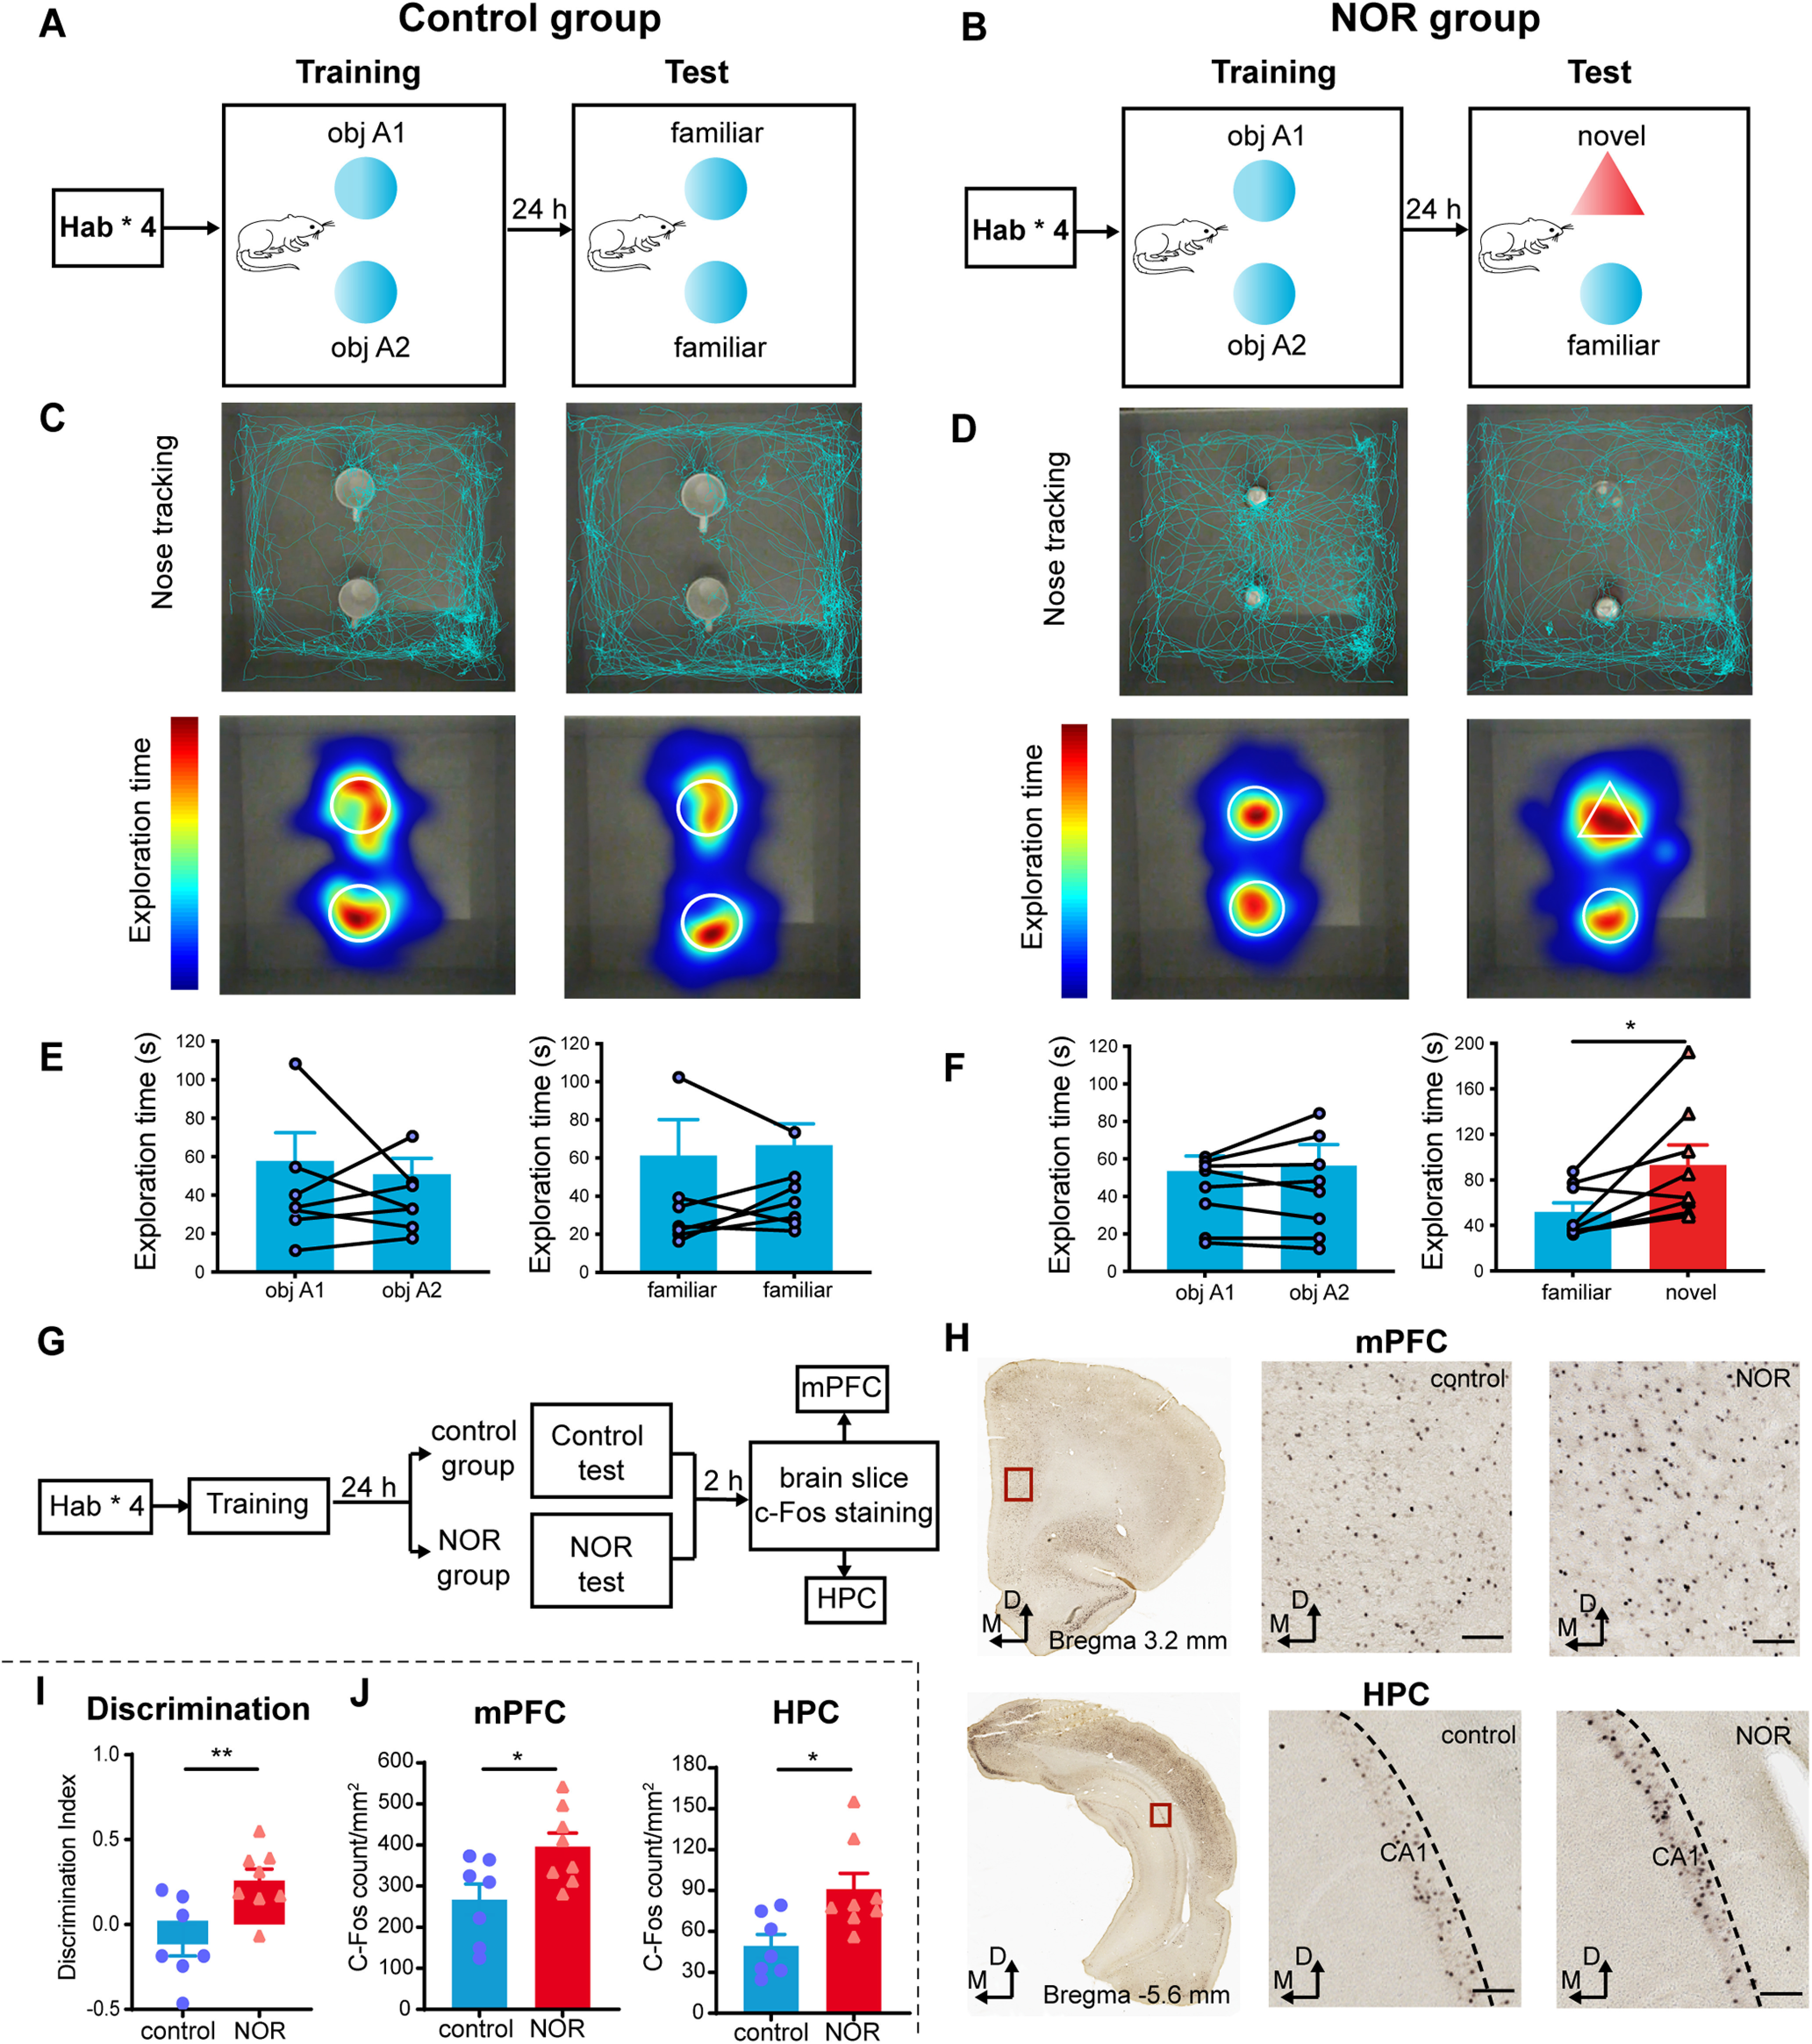
Figure 1.

c-Fos expression increases in the mPFC and HPC with NOR. A, B, Schematics illustrating the behavioral task for the control group (A) and the NOR group (B). C, D, Nose tracking (top) and exploratory behavior heat maps (bottom) of one representative rat during training (left) and test (right) in the control group (C) and the NOR group (D). E, Rats in the control group showed no discrimination of the two identical objects in training (left; paired two-sided t test, t(6) = 0.4907, p > 0.05, N = 7 rats) and testing (right; two-sided Wilcoxon matched-pairs signed-rank test, p > 0.05, N = 7 rats). Mean ± SEM. F, Rats in the NOR group showed no discrimination of the two identical objects in training (left) but displayed novel object exploration preference in testing (right; two-sided Wilcoxon matched-pairs signed-rank test, *p < 0.05, N = 8 rats). Values are the mean ± SEM. G, Two experimental groups designed to examine NOR-related c-Fos expression. H, Representative immunohistochemical staining for the c-Fos-positive cells from the control group and NOR group in the mPFC (top) and HPC (bottom). Scale bar, 100 µm. I, The discrimination index between the NOR group and the control group (unpaired two-sided t test, control vs NOR, t(13) = 3.174, **p < 0.01). J, Mean number of c-Fos-positive cells in the mPFC (left) and HPC (right) of the control and NOR groups (two-sided Mann–Whitney test; mPFC: Mann–Whitney U = 7, *p < 0.05, N = 7 rats; unpaired two-sided t test: HPC: t(13) = 2.787, *p < 0.05, N = 8 rats). Values are the mean ± SEM.
