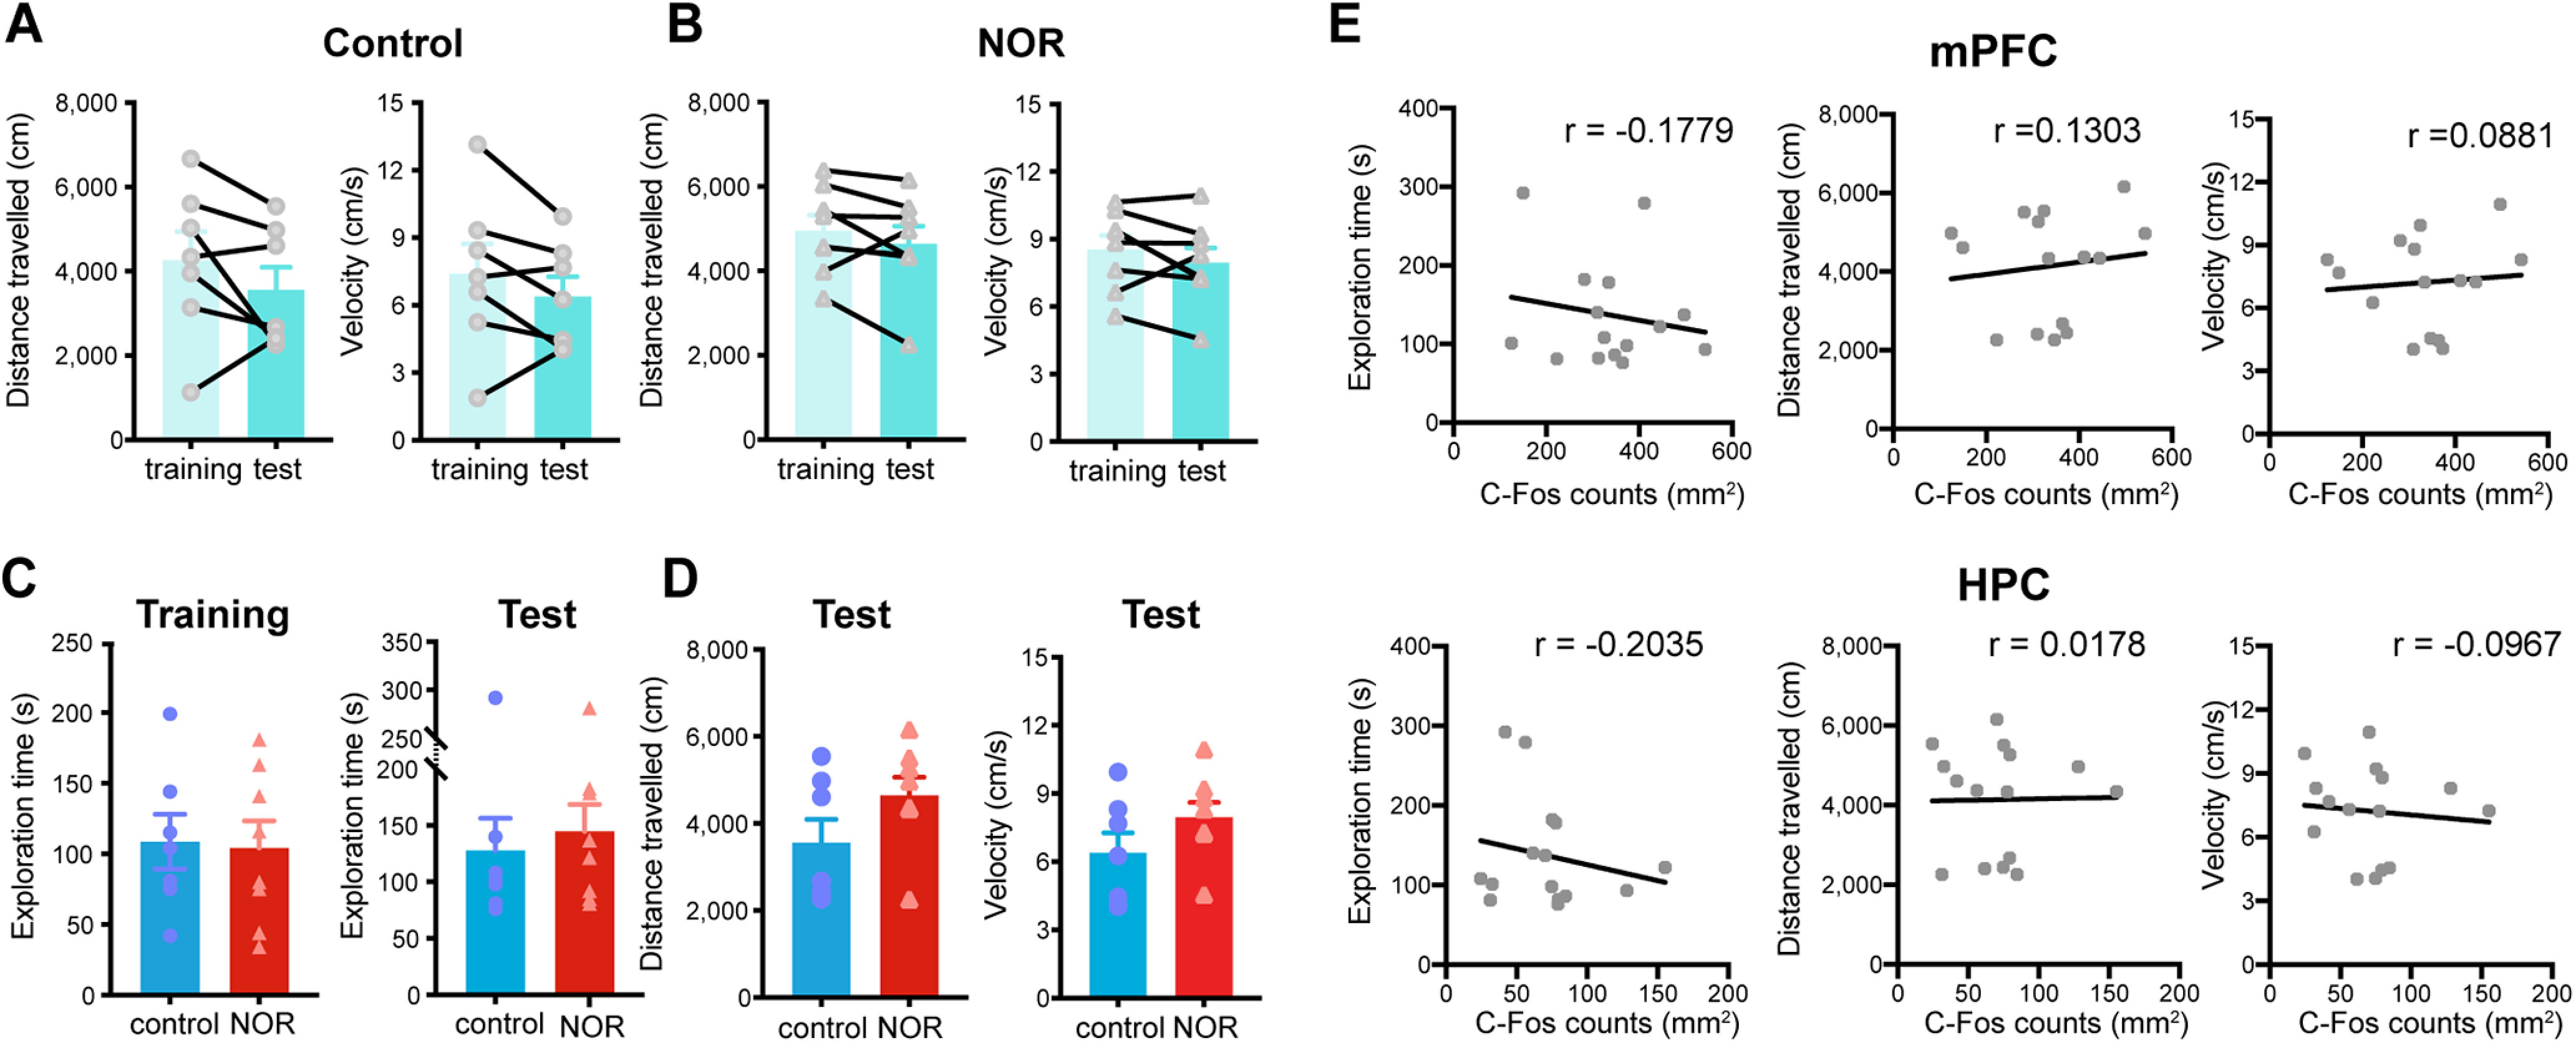
Figure 2.

There is no change in overall locomotion during novel object exploration. A, B, Mean distance traveled (left) and velocity (right) during the training and test sessions for the rats in the control group (two-sided Wilcoxon matched-pairs signed-rank test, travel distance: p > 0.05; paired two-sided t test, velocity: t(6) = 1.455, p > 0.05, N = 7 rats; A) and NOR group (paired two-sided t test; travel distance: t(7) = 1.309, p > 0.05; velocity: t(7) = 1.336, p > 0.05, N = 8 rats; B). Values are the mean ± SEM. C, Mean total object exploration time between the control and NOR groups in the training (left) or test (right) session (unpaired two-sided t test, training: t(13) = 0.1573, p > 0.05, N = 7 rats; two-sided Mann–Whitney test, test: Mann–Whitney U = 22, p > 0.05, N = 8 rats). Values are the mean ± SEM. D, Mean distance traveled (left) and velocity (right) in the test session did not show change between the control and NOR groups (two-sided Mann–Whitney test, distance traveled: Mann–Whitney U = 19, p > 0.05, N = 7 rats; unpaired two-sided t test, velocity: t(13) = 1.437, p > 0.05, N = 8 rats). Values are the mean ± SEM. E, Correlation between the exploration time (left; r = −0.1779, p > 0.05), distance traveled (middle; r = 0.1303, p > 0.05), and velocity (right; r = 0.0881, p > 0.05) of individual rats and their mPFC c-Fos counts (top: N = 15 rats, two-sided Spearman's correlation test) or HPC c-Fos counts (r = −0.2035, p > 0.05, r = −0.0178, p > 0.05, r = −0.0967, p > 0.05; bottom: N = 15 rats, two-sided Spearman's correlation test).
