Figure 3.

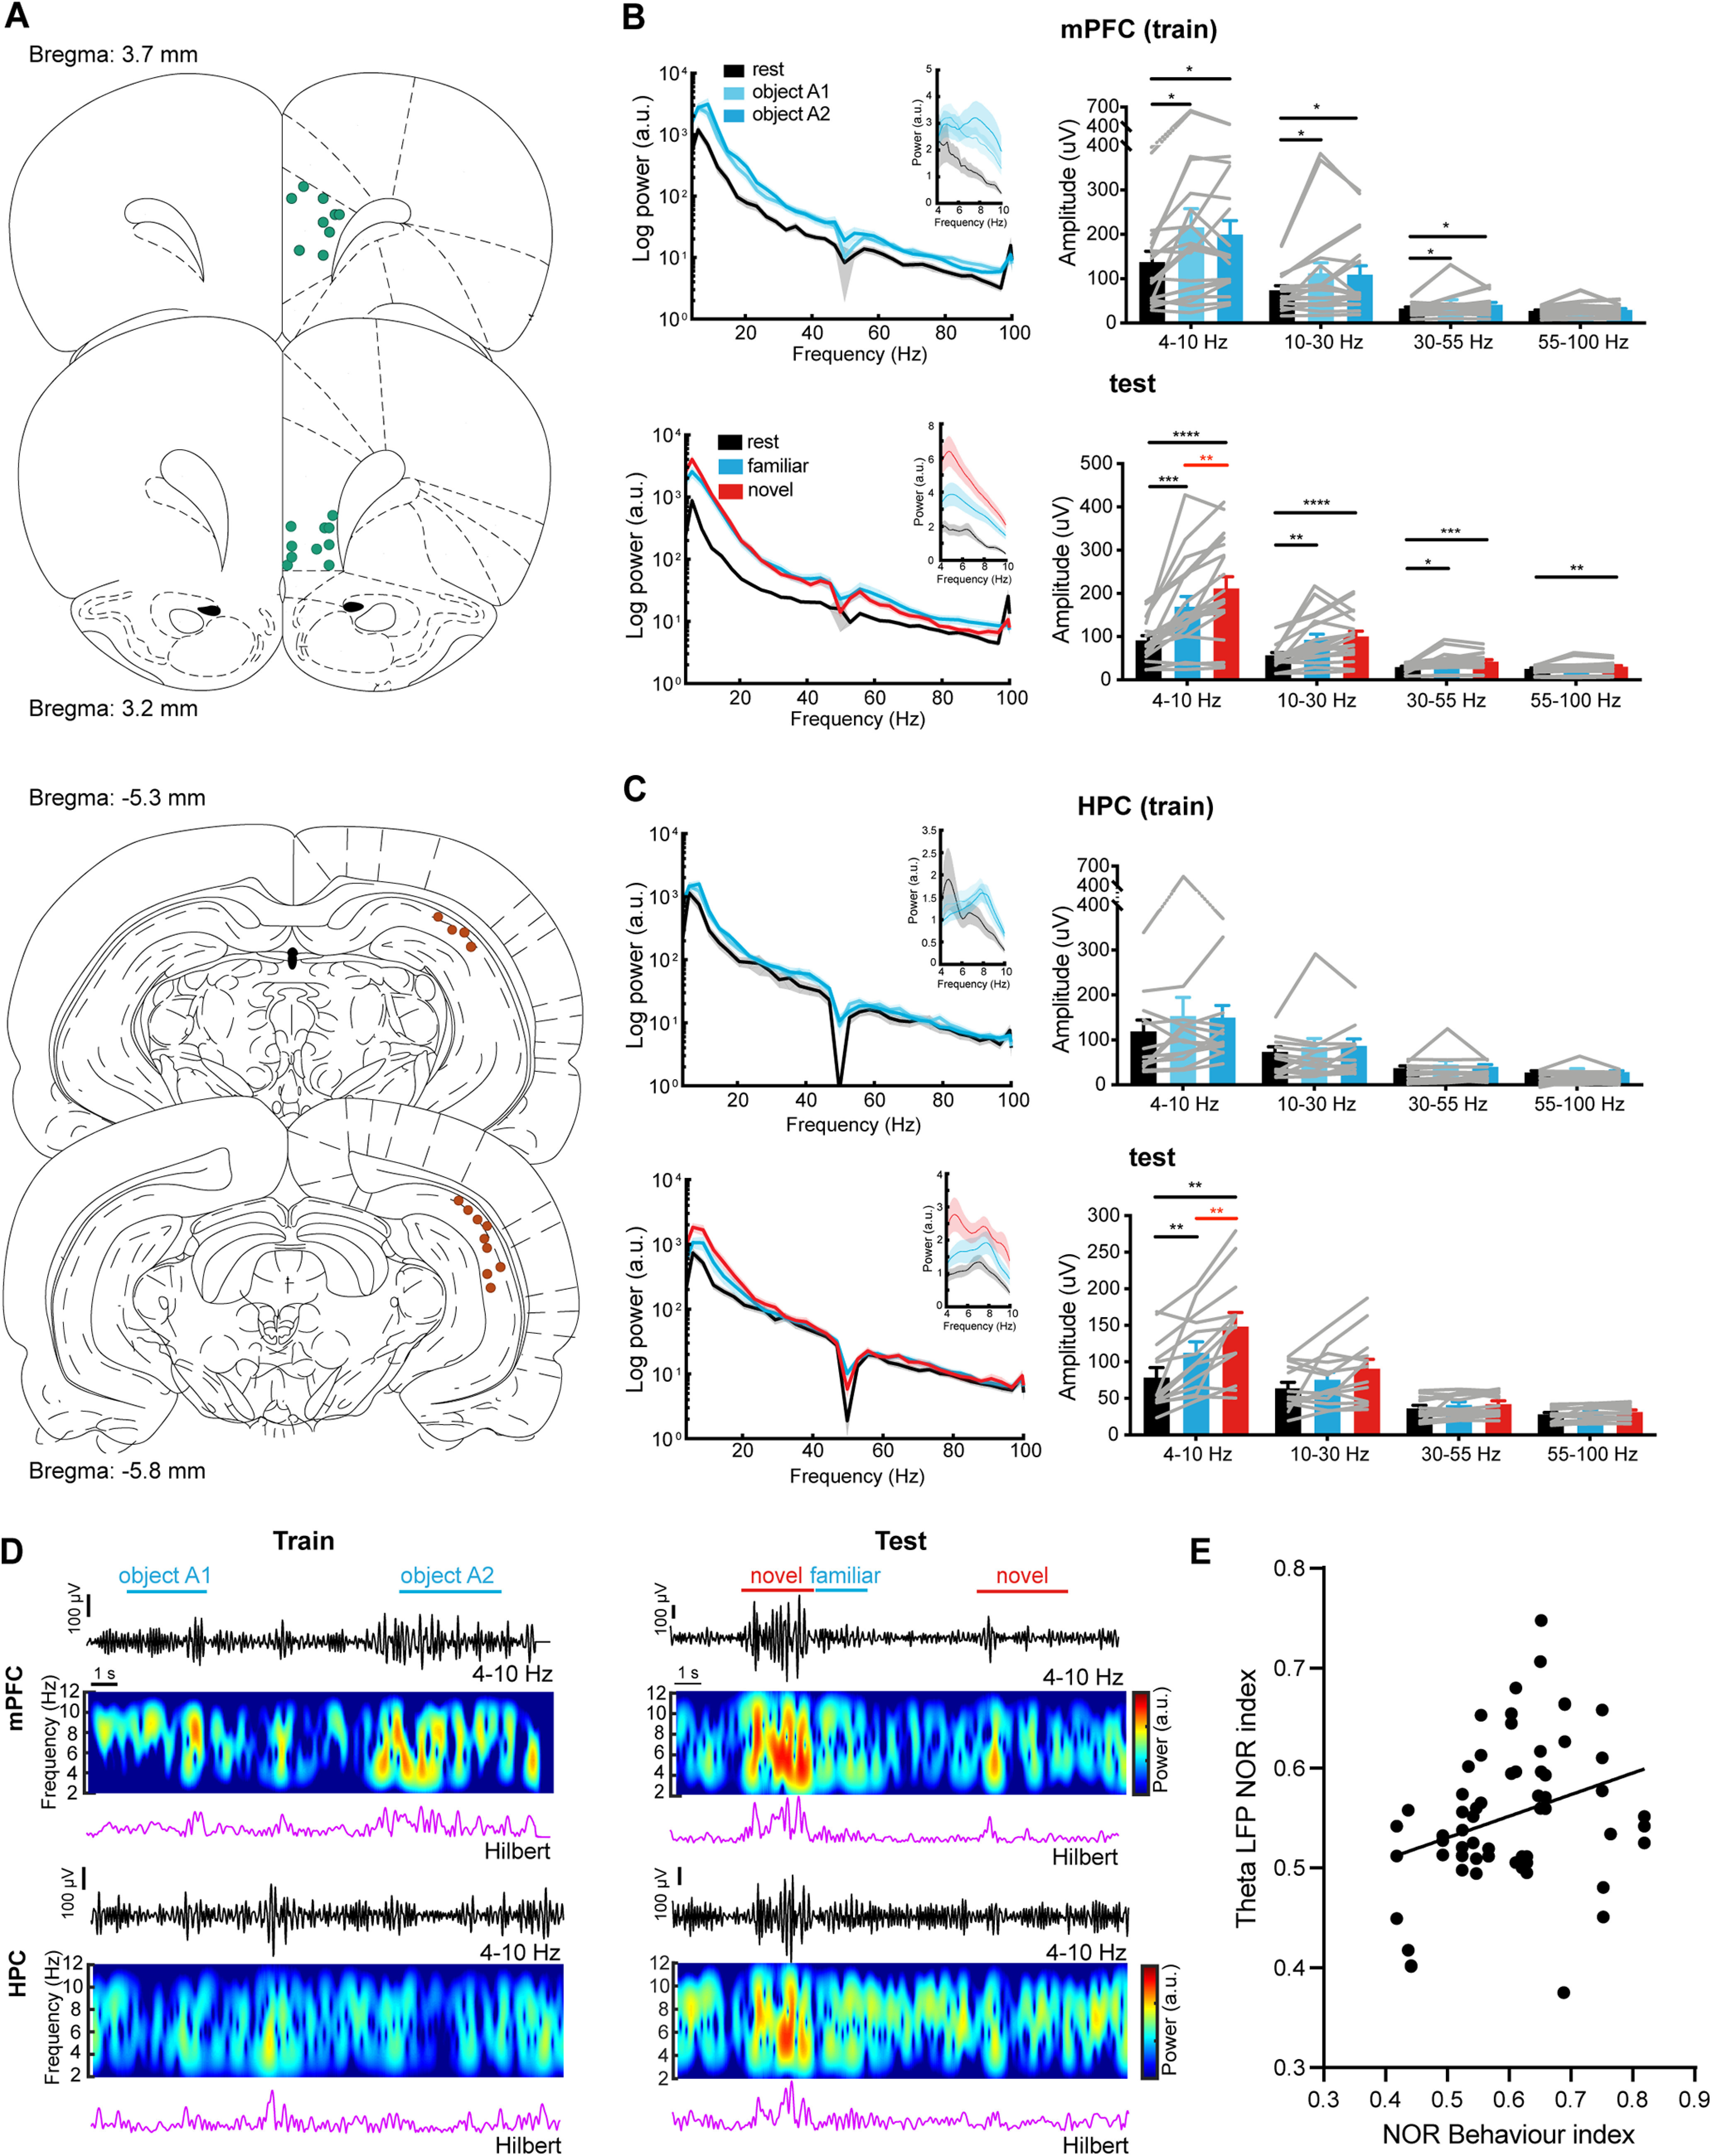
Novel object recognition enhances theta (4–10 Hz) activity in the mPFC and HPC. A, Schematics showing the placement of LFP recording electrode tips in the mPFC (top, n = 19) and the HPC (bottom, n = 13). Bregma locations for each section are indicated. B, Left, Mean log PSD in the mPFC during resting state, and object exploration during training (top) and testing (bottom). Insets show the mean PSD within 4–10 Hz. Right, Mean LFP amplitudes from the mPFC for different frequency bands are shown during training (top) and testing (bottom; Friedman test with repeated measures: mPFC training, n = 19; theta, Friedman statistic = 9.680; beta, Friedman statistic = 9.579; slow gamma, Friedman statistic = 10.96; fast gamma, Friedman statistic = 6.836. mPFC test, n = 19. One-way ANOVA with repeated measures: theta, F(2,16) = 26.77; Friedman test with repeated measures: beta, Friedman statistic = 21.89; slow gamma, Friedman statistic = 15.81; fast gamma, Friedman statistic = 11.53). C, Left, Mean log PSD in the HPC during resting state, and object exploration during training (top) and testing (bottom). Insets show the mean PSD within 4–10 Hz. Right, Mean amplitudes from the HPC LFP for different frequency bands are shown during training (top) and testing (bottom; Friedman test with repeated measures: HPC training, n = 13; theta, Friedman statistic = 5.692; beta: Friedman statistic = 0.4615; slow gamma, Friedman statistic = 3.447; fast gamma: Friedman statistic = 2.851. One-way ANOVA with repeated measures; HPC test, n = 13; theta, F(2,10) = 17.15; beta: F(2,10) = 4.955; slow gamma: F(2,10) = 2.661; fast gamma: F(2,10) = 3.218). Values are the mean ± SEM. n represents the number of LFP recording sites. *p < 0.05, **p < 0.01, ***p < 0.001, ****p < 0.0001. D, Representative example of simultaneous recordings from mPFC (top) and HPC (bottom). Traces on top show the filtered (4–10 Hz) LFP, color-coded PSD (middle), and Hilbert amplitude (bottom) during the training session (left) and the test session (right). Specific object exploration epochs are indicated by the colored lines. E, Correlation between the mPFC/HPC theta LFP NOR index and the NOR behavior index of the animals (r = 0.3046, *p < 0.05, n = 61 sessions, two-sided Pearson's correlation).
