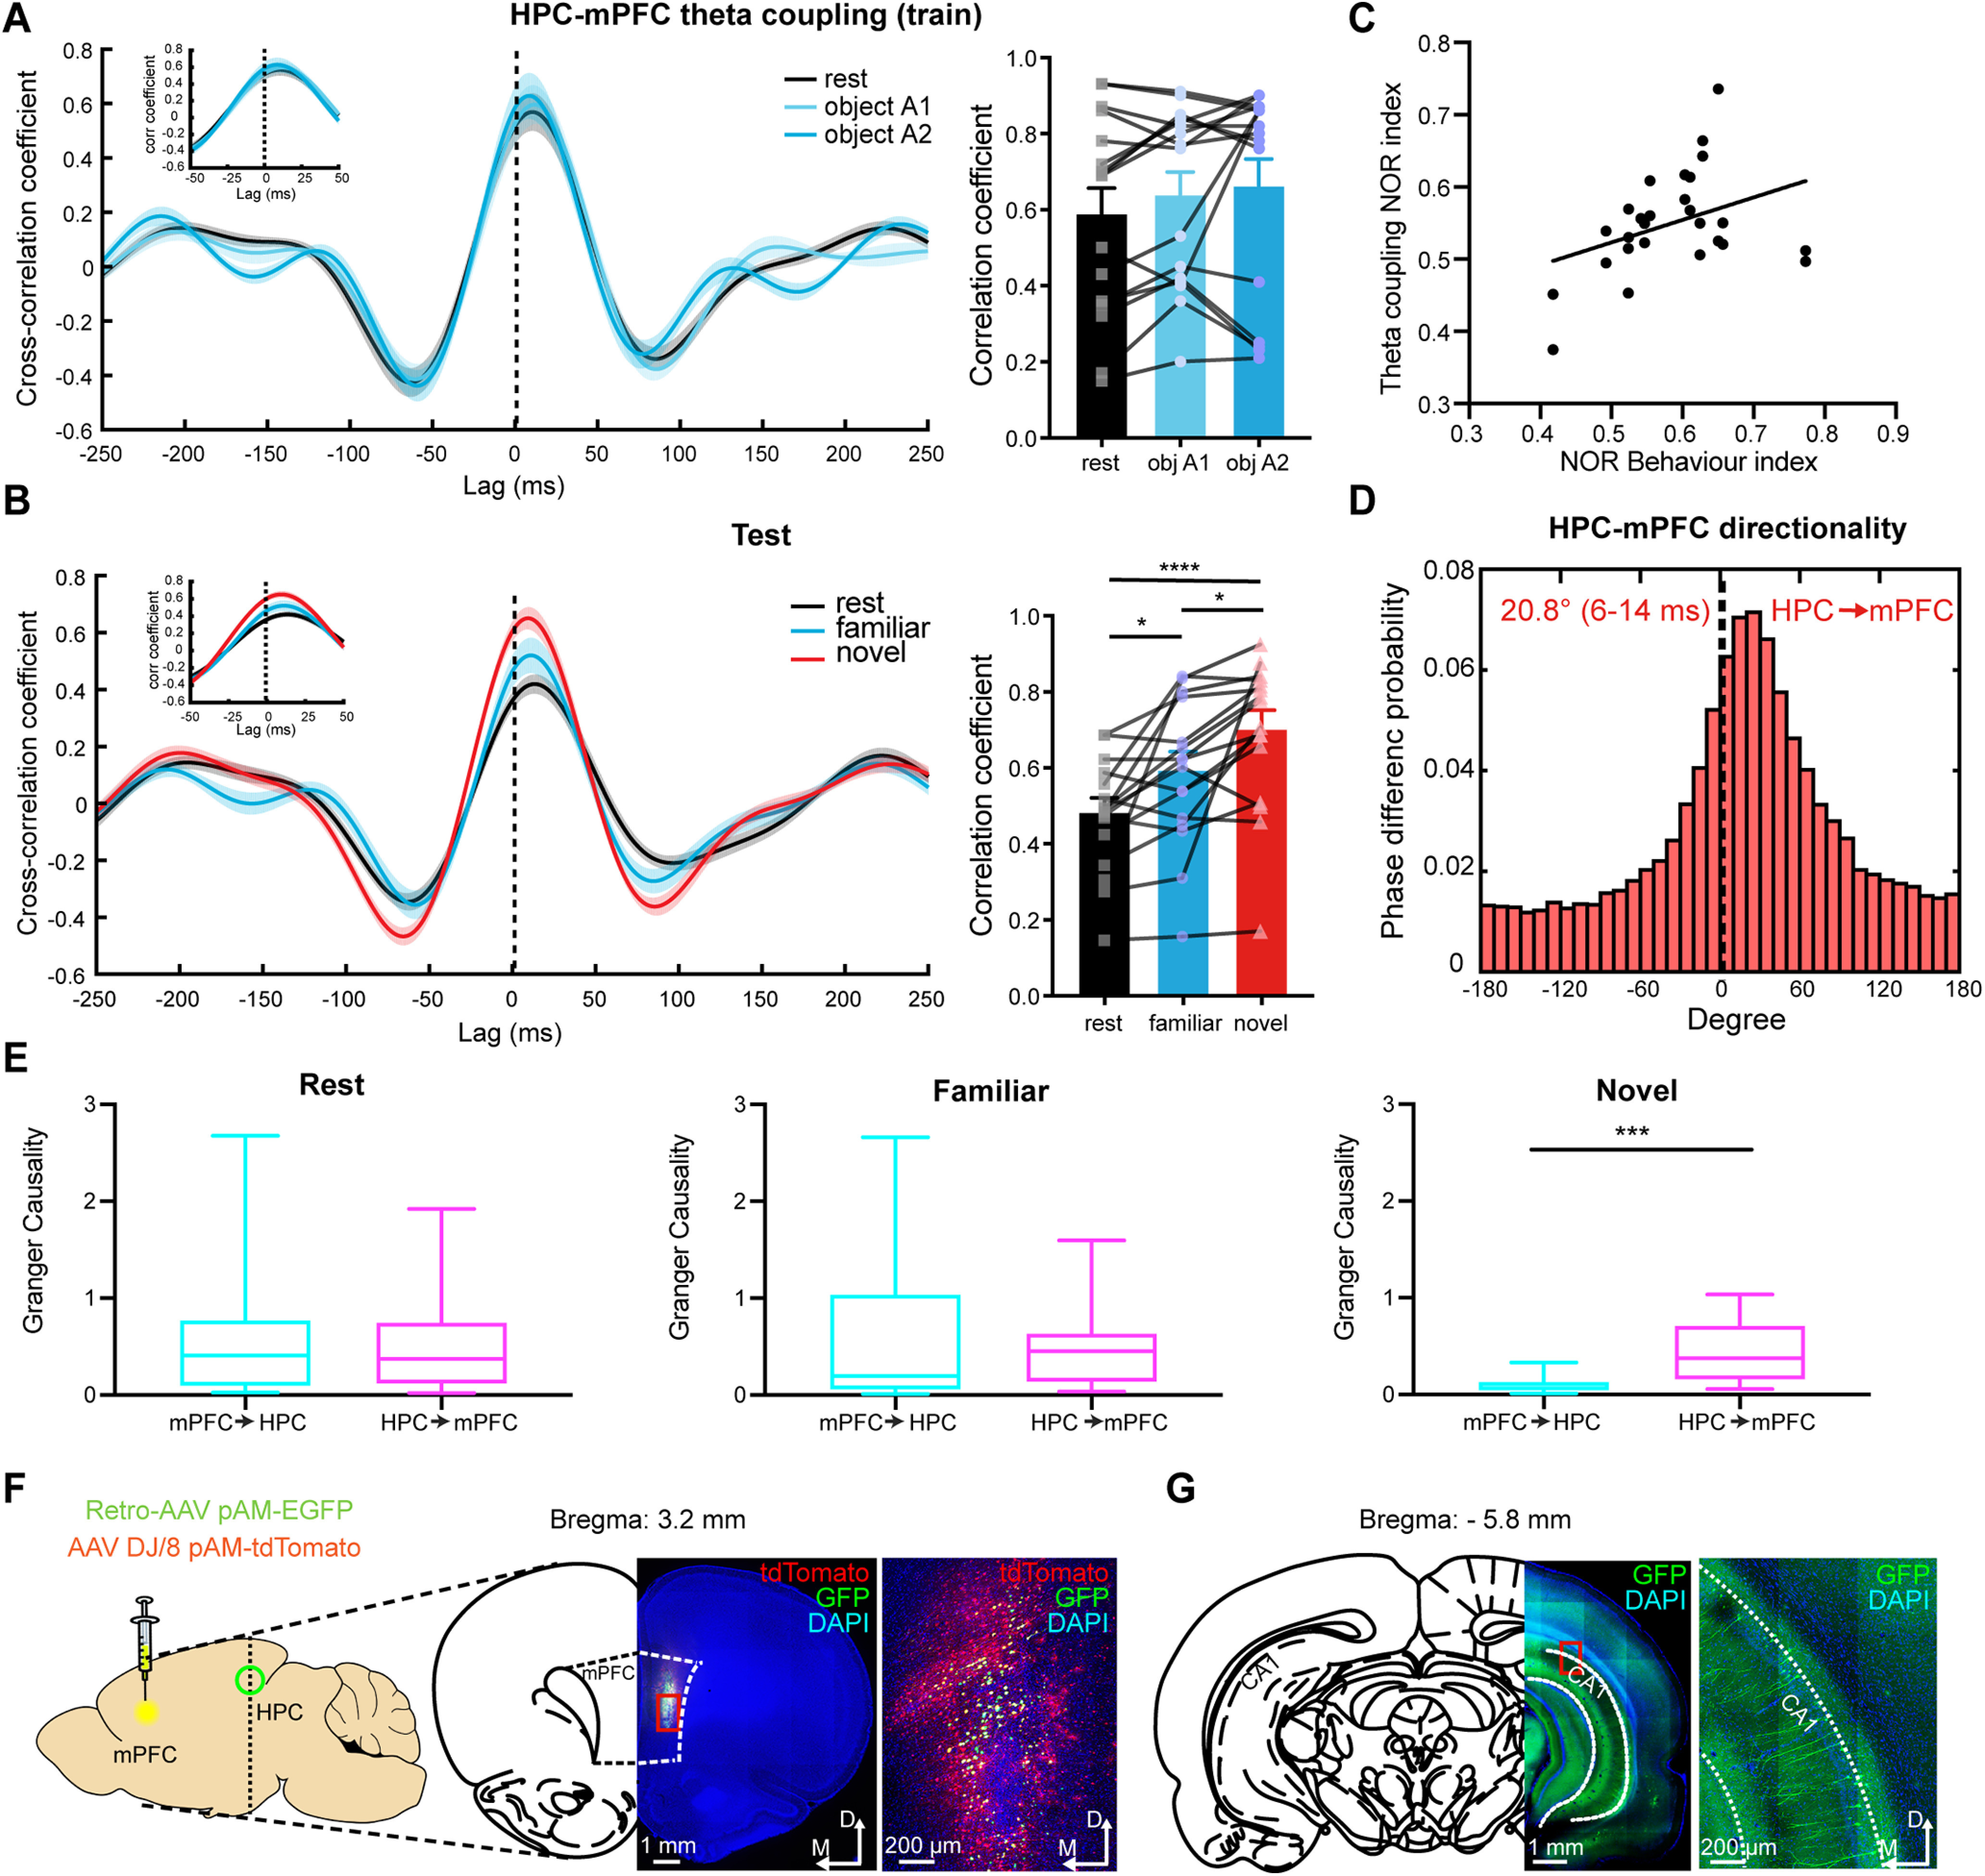
Figure 4.

HPC–mPFC theta (4–10 Hz) coupling is enhanced during NOR. A, Left, The HPC–mPFC theta LFP cross-correlation during training. Right, Mean peak HPC–mPFC theta LFPs cross-correlation coefficient showed no significant difference in NOR training (Friedman test with repeated measures; Friedman statistic = 1.556, n = 16 LFP pairs). Values are the mean ± SEM. B, Left, The HPC–mPFC theta LFP cross-correlation during test. Right, The mean peak HPC–mPFC theta LFP cross-correlation coefficient showed significant enhancement in the NOR test (one-way ANOVA with repeated measures: F(2,13) = 12.77, n = 16 LFP pairs). The dashed line represents the zero-lag time. Values are the mean ± SEM. *p < 0.05, ****p < 0.0001. The insets show correlation within ±50 ms. C, Correlation between the mPFC/HPC theta LFP coupling NOR index and the NOR behavioral index (two-sided Pearson's correlation: r = 0.3046, p < 0.05, n = 28 sessions). D, Phase difference probability histograms of the HPC–mPFC theta LFPs during NOR (Rayleigh's test, p < 0.0001; bin size = 10°). E, Theta spectral Granger causality of the HPC driving the mPFC (magenta, HPC → mPFC) and the mPFC driving the HPC (cyan, mPFC → HPC) in the NOR test session (two-sided Wilcoxon matched-pairs signed-rank test: ***p < 0.001, n = 16 LFP pairs). In the box plots, the boundary of the box closest to zero indicates the 25th percentile, a line within the box marks the median, and the boundary of the box farthest from zero indicates the 75th percentile. Whiskers above and below the box indicate the maximum and minimum. F, Unilateral injection of retrogradely transported AAV (GFP) into the rat mPFC (AAV DJ/8 vector was used as a marker: tdTomato). G, Labeled pyramidal neurons in the ipsilateral CA1 region of the ventral HPC.
