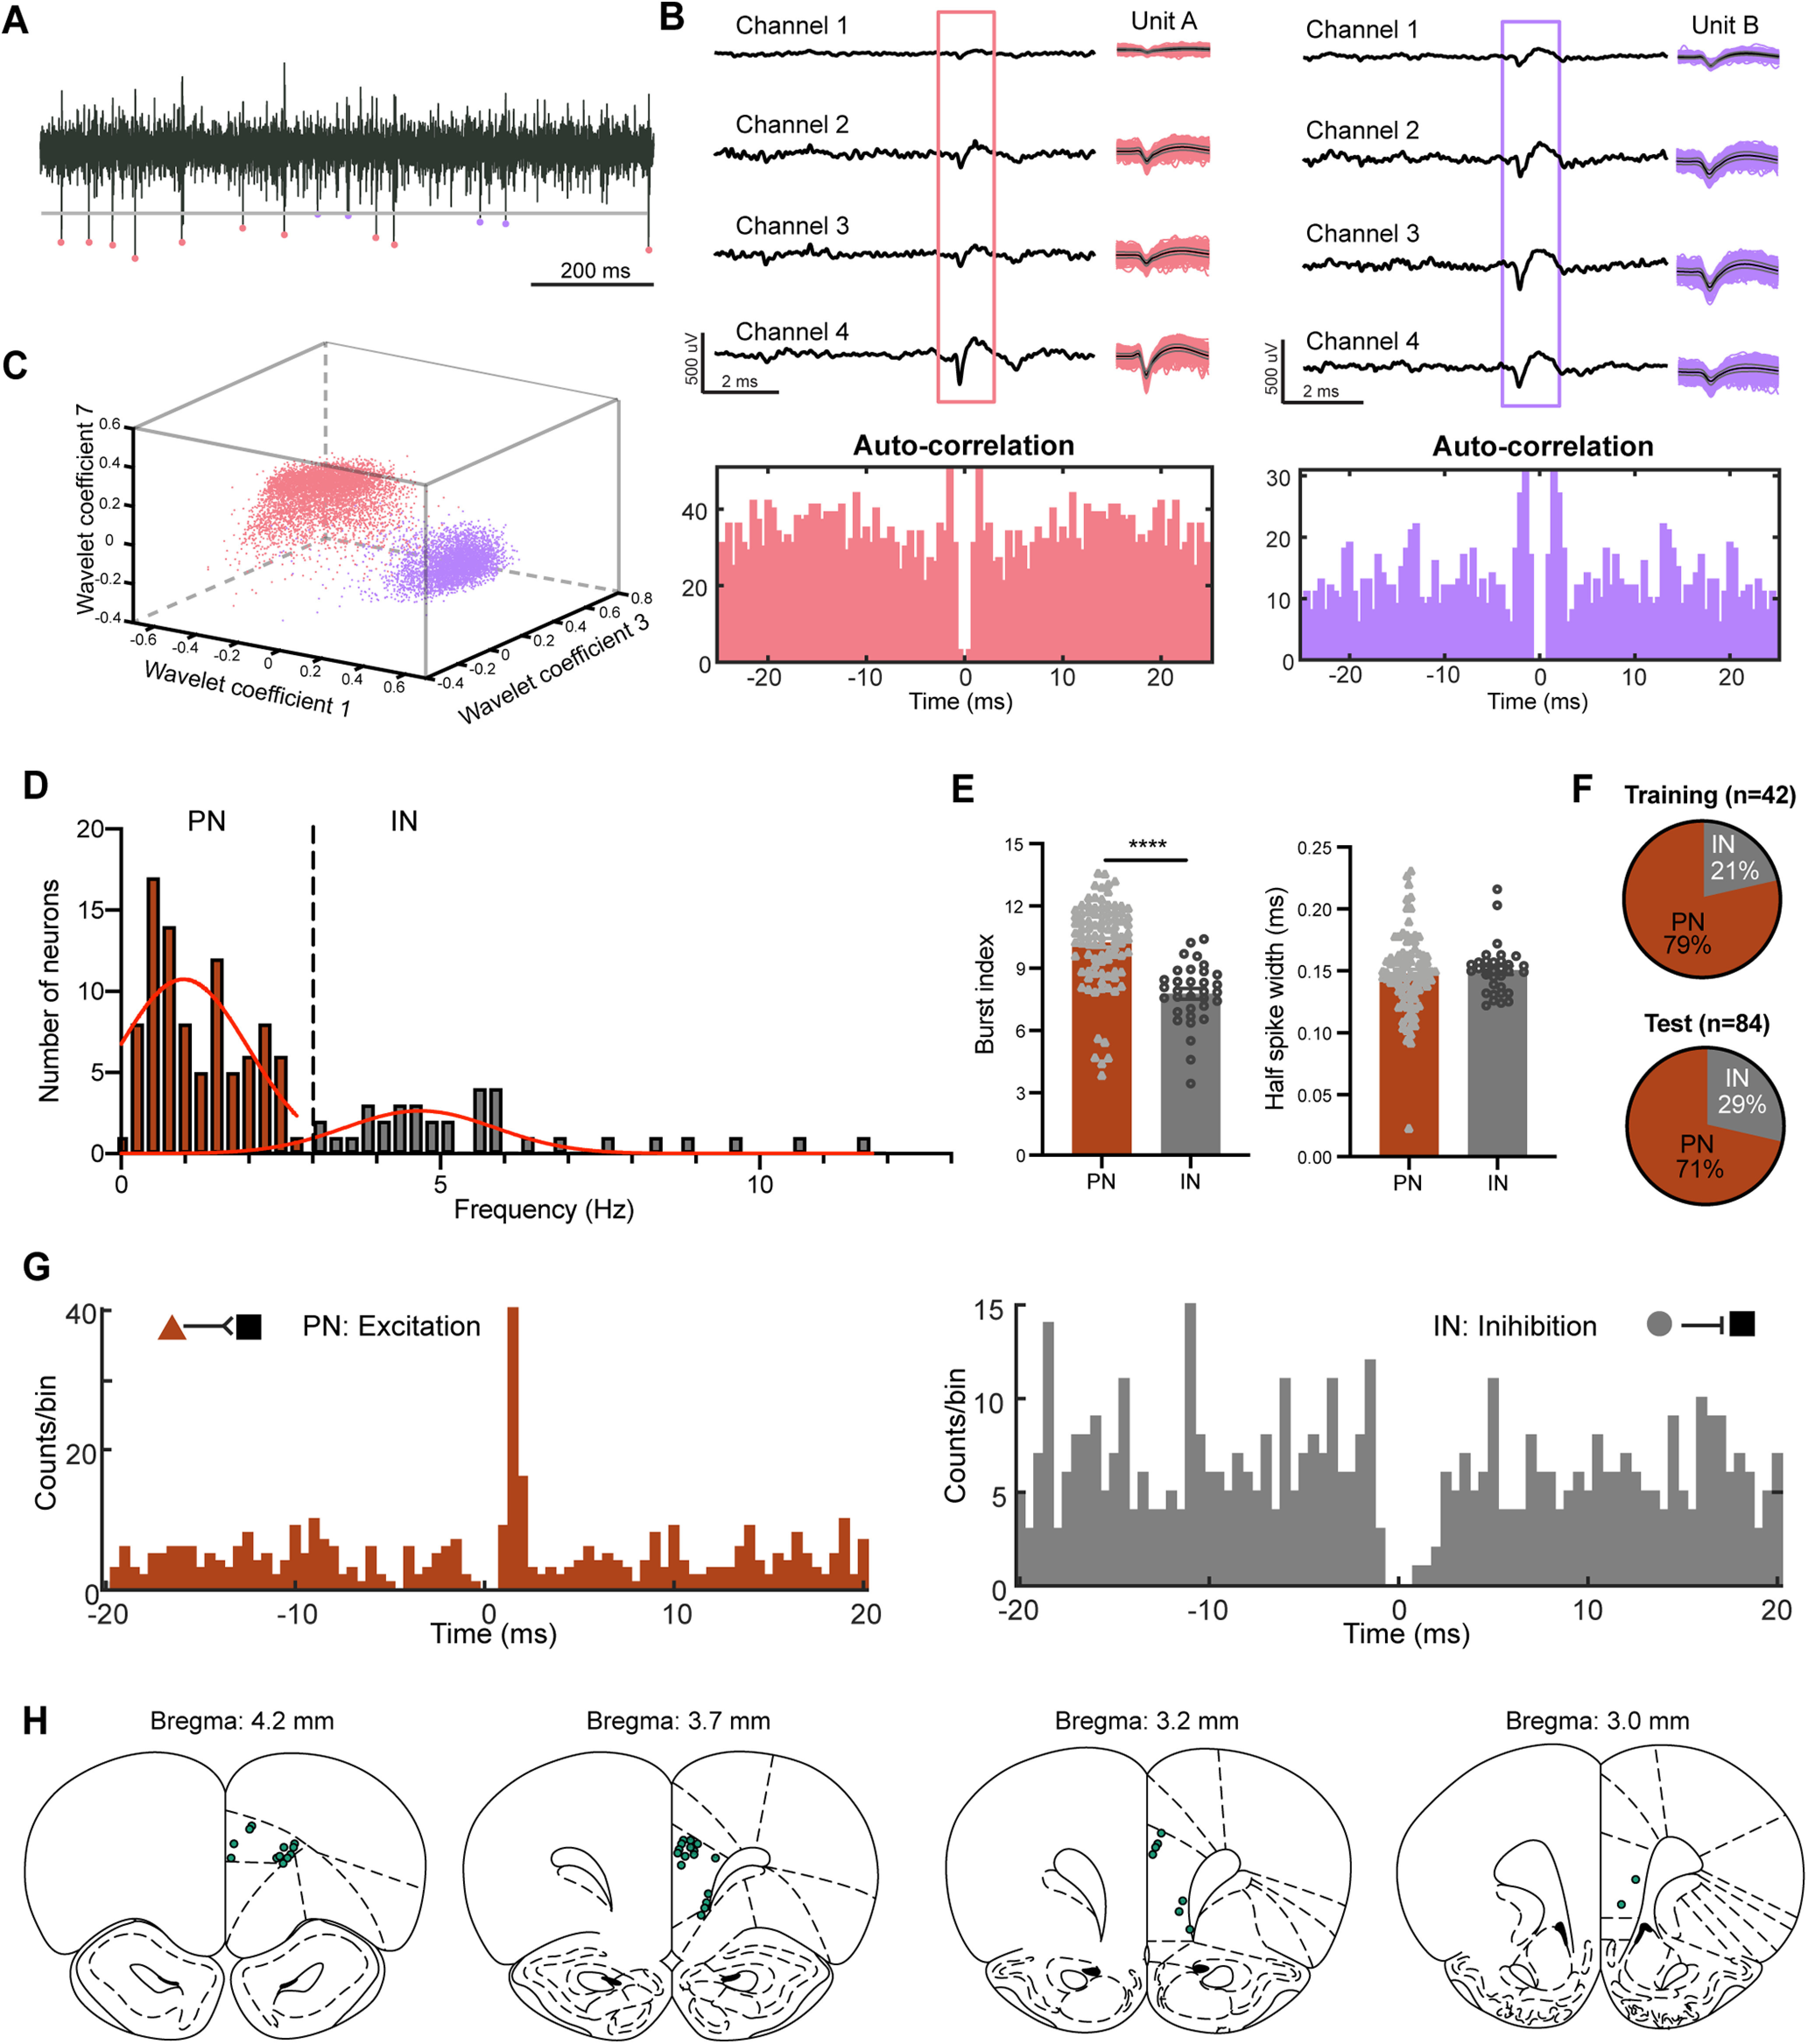
Figure 5.

Principal neurons and interneurons in the mPFC during the NOR task. A, Raw trace showing extracellular unit activity recorded from the mPFC. Two distinct units from one tetrode in the mPFC during one test session, marked by different colors. Unit A, Rose; Unit B, lavender. Gray line represents the spike detection threshold. B, Representative traces showing the recording of waveforms on each of the tetrode channels for Unit A (left) and Unit B (right). Autocorrelations for each unit are shown below. C, The three-dimensional projections of the feature vectors of Unit A and Unit B in wavelet coefficients 1, 7, and 3. For the details of the spike-sorting software and analysis see Materials and Methods. D, Histogram of spontaneous firing rates for all well isolated units in the mPFC. The overall distribution of spontaneous firing rates showed approximately two peaks and was best fit with two Gaussians (red curves). We separated units into putative PNs (firing rates, <3 Hz) and INs (firing rates, >3 Hz). E, PNs had significantly higher levels of bursting activity than INs (10.23 ± 0.21 vs 7.77 ± 0.26; two-sided Mann–Whitney test, Mann–Whitney U = 426; ****p < 0.0001), but did not differ significantly in spike width (0.148 ± 0.003 vs 0.151 ± 0.003 ms; two-sided Mann–Whitney test: Mann–Whitney U = 1449, p > 0.05). F, Proportions of PNs and INs from the mPFC sorted during training (top) and test (bottom) sessions. G, Left, Representative cross-correlogram between a putative PN and another neuron showing a short-latency, presumably monosynaptic excitatory interaction. Right, Representative cross-correlogram between a putative IN and another neuron showing a gap, possibly monosynaptic, inhibitory interaction. Reference events correspond to the spikes of the presynaptic neuron (bins, 0.5 ms). Triangle, PN; circle, IN; squares, other neurons. H, Placement of tetrode tips in the mPFC of all rats performing NOR task.
