Figure 6.

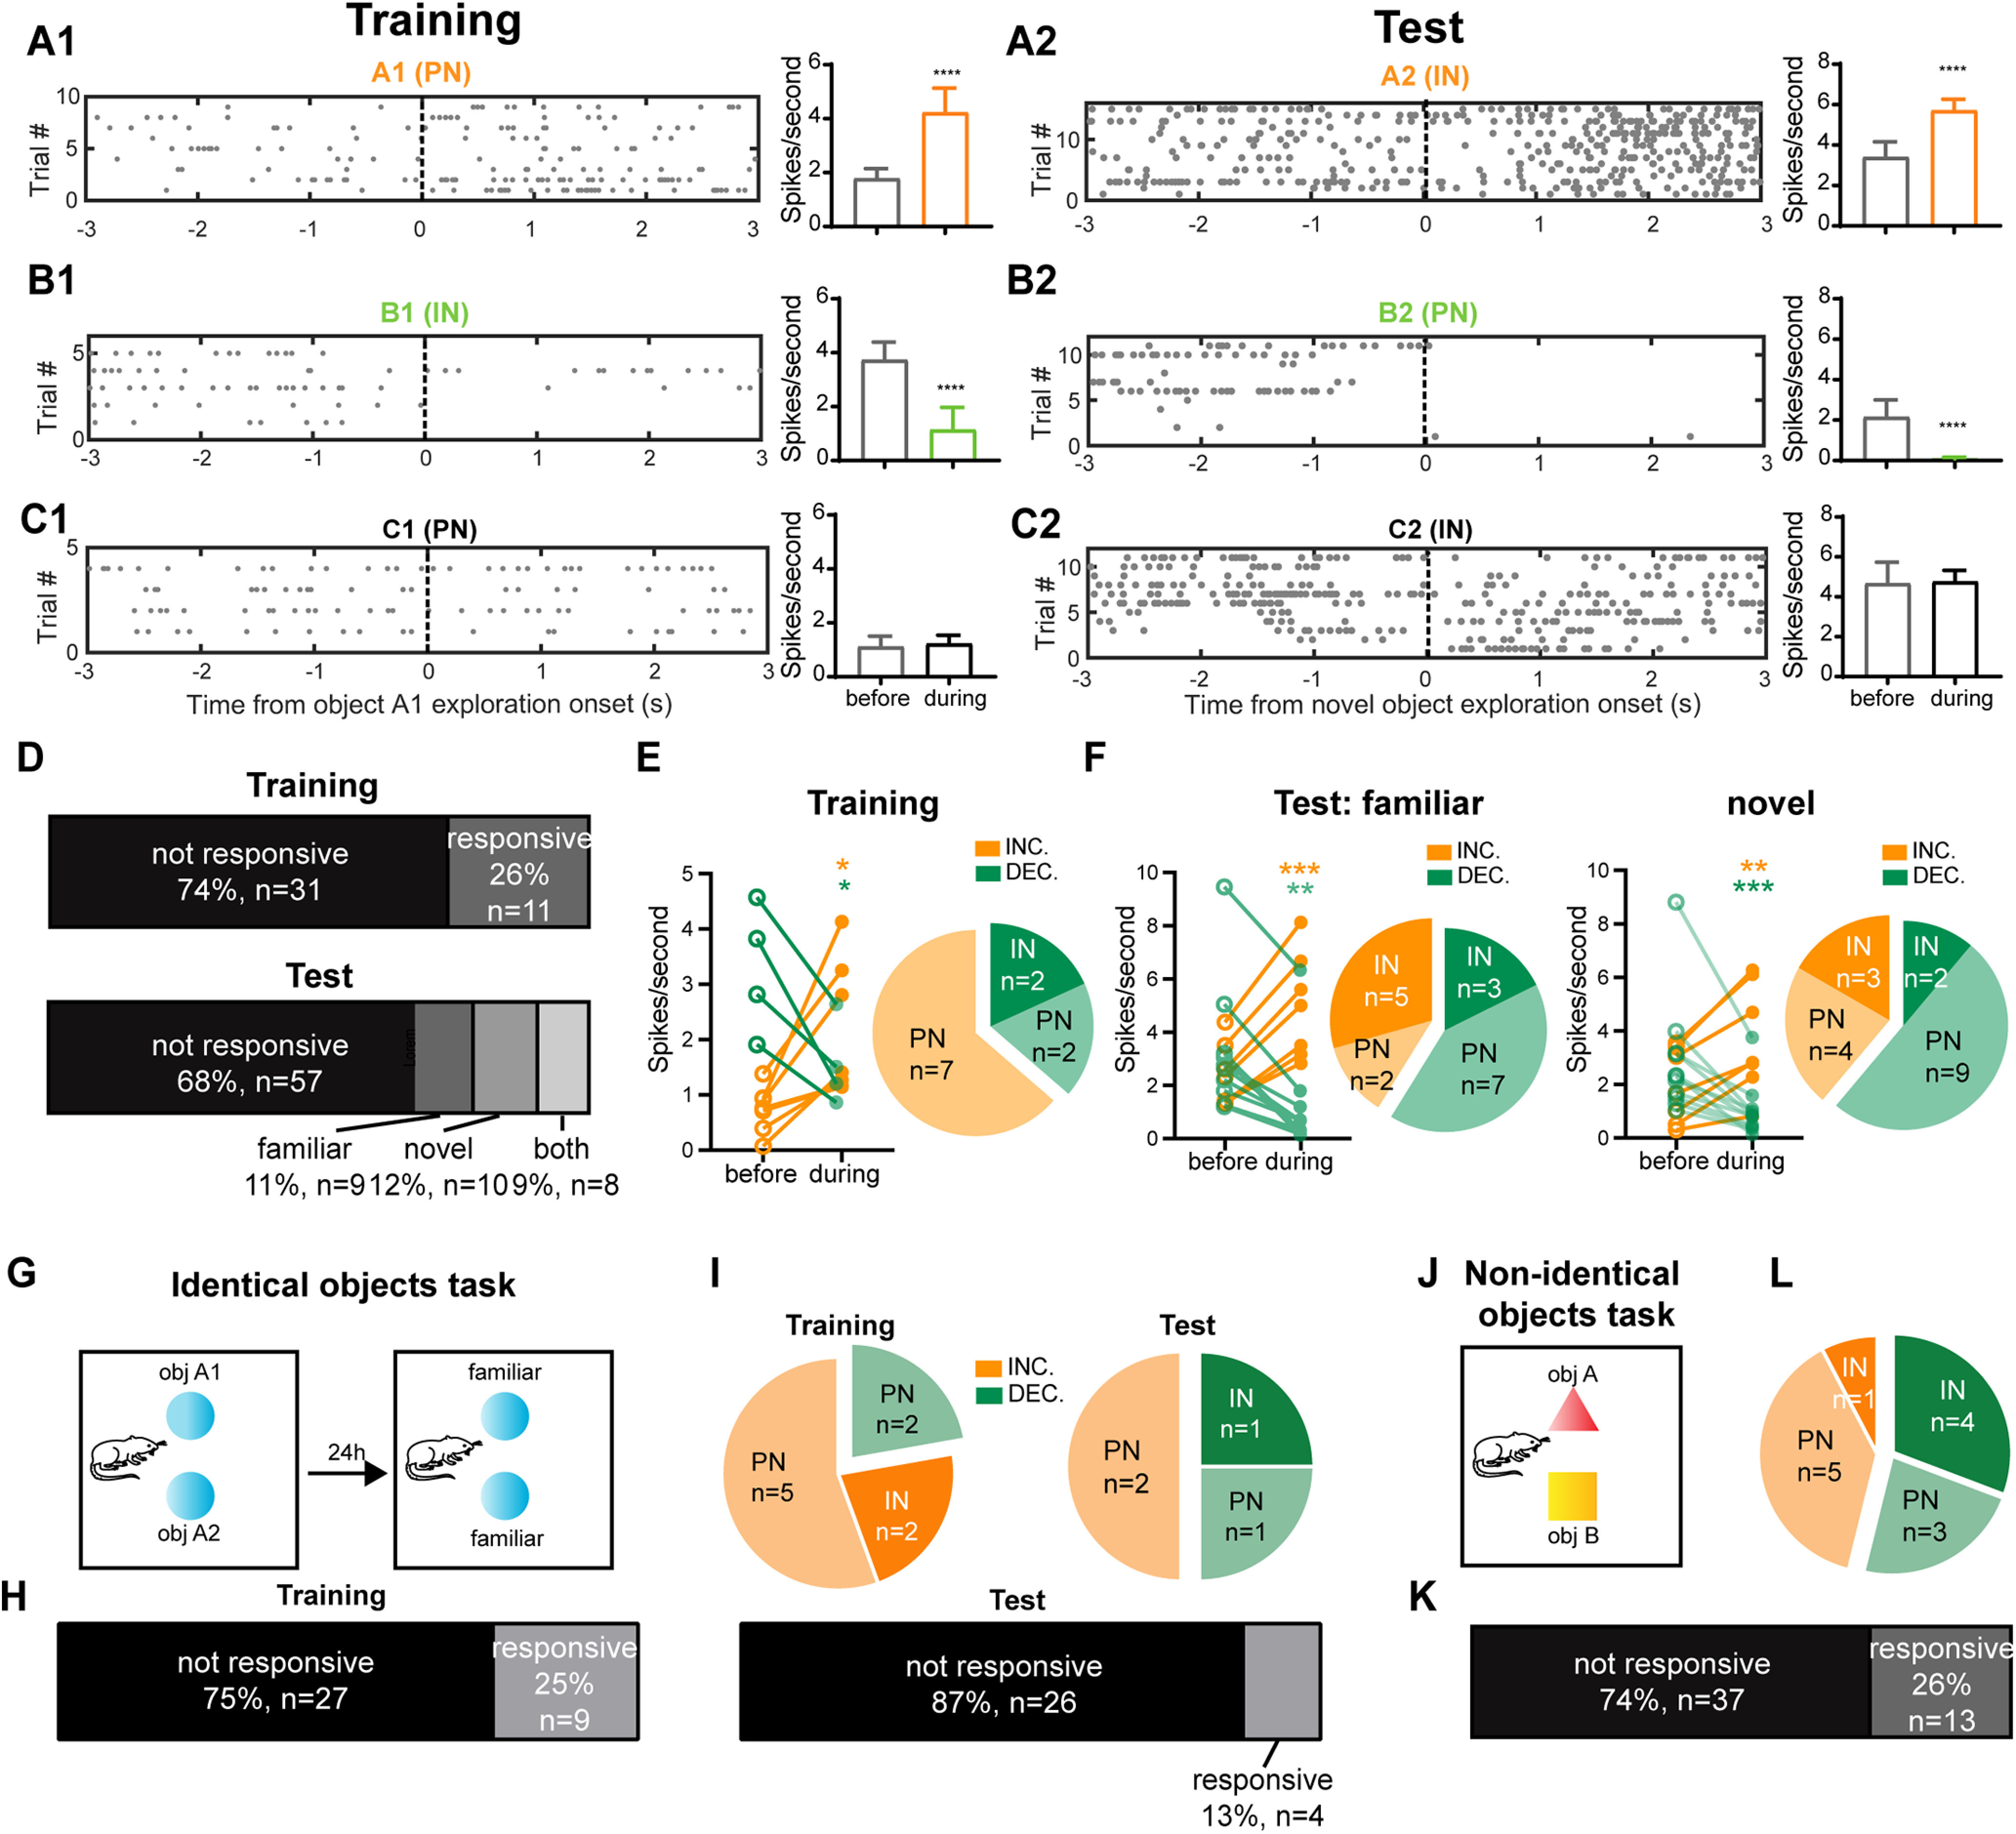
Principal neurons and interneurons in the mPFC respond to objects differently during NOR training and test sessions. A1, B1, C1, Three representative neurons showing an increase (PN, ****p < 0.0001, n = 9 trials; A1), a decrease (IN, ****p < 0.0001, n = 5 trials; B1), or no change (PN, p > 0.05, n = 4 trials; C1) in discharge during object exploration in the training session. Left, Raster plot of individual spike times with each row representing a trial. Right, Mean firing rates across the trials, mean ± SEM. Time zero marks the start of object exploration. All the tests are two-sided Wilcoxon rank-sum tests. A2, B2, C2, Representative responses of three neurons during the test session showing an increase (IN, ****p < 0.0001, n = 15 trials; A2), a decrease (PN, ****p < 0.0001, n = 11 trials; B2), or no response (IN, p > 0.05, n = 11 trials; C2) to object exploration. Left, raster plot of individual spike times with each row representing a trial; right, mean firing rates across the trials. Values are the mean ± SEM. All tests are two-sided Wilcoxon rank-sum tests. D, Top, Percentages of object-responsive neurons during training (n = 42); bottom, during testing (n = 84). E, Scatter plot shows the response of neurons during exploration of objects. Neurons in the mPFC respond by either increasing (orange, INC.) or decreasing (green, DEC.) their discharge rate (two-sided Wilcoxon matched-pairs signed-rank test, INC: *p < 0.05, n = 7 cells; paired two-sided t test, DEC: t3 = 4.933, *p < 0.05, n = 4 cells). The pie chart on the right separates responsive cells into PNs and INs. F, Response of neurons to familiar (left) and novel (right) objects during the test session. Scatter plots shows the response of neurons during exploration of familiar (left) and novel (right) objects (familiar object responsive; paired two-sided t test, INC.: t(6) = 8.298, ***p < 0.001, n = 7 cells; two-sided Wilcoxon matched-pairs signed-rank test, DEC.: **p < 0.01, n = 10 cells; novel object responsive: paired two-sided t test, INC.: t(6) = 5.814, **p < 0.01, n = 7 cells; two-sided Wilcoxon matched-pairs signed-rank test, DEC.: ***p < 0.001, n = 11 cells). The pie charts separate responsive cells into PNs and INs for response to familiar (left) and novel (right) objects. G, Schematic of the identical objects task. H, Numbers of mPFC object-responsive neurons during the identical objects task training (left) and test (right) sessions. I, Pie charts show the proportions PNs and INs that respond during object exploration by increasing (orange, INC.) or decreasing (green, DEC.) their firing rate (two-sided Wilcoxon matched-pairs signed-rank test) in the identical objects task. J, Schematic of the nonidentical objects task. K, Numbers of mPFC object-responsive neurons during the nonidentical objects task. L, Pie charts show the proportions PNs and INs that respond during object exploration by increasing (orange, INC.) or decreasing (green, DEC.) their firing rate (two-sided Wilcoxon matched-pairs signed-rank test) in the nonidentical objects task.
