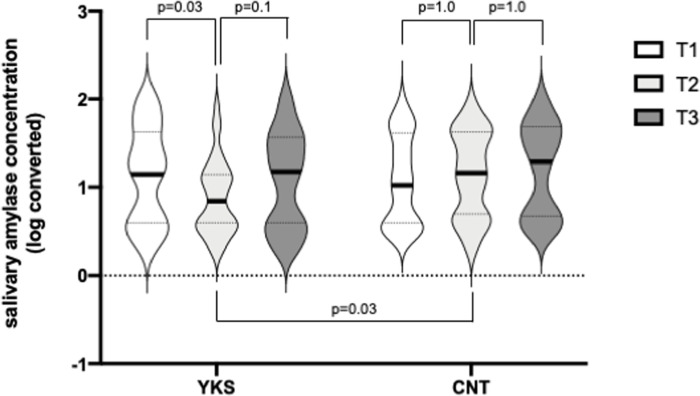
Fig 2. Salivary-α-amylase activity.
Comparison of salivary-α-amylase activity in the Yokukansan (YKS) (a) and control (CNT) (b) groups by violin plots. Plot width is scaled to data distribution. Horizontal bars represent medians, and dashed lines represent 25th and 75th percentiles. The vertical axis represents logarithmically converted values. Data were analyzed by a two-way repeated-measures ANOVA and pre-specified follow-up tests of primary outcomes. Using a modified sequentially rejective Bonferroni test, a primary outcome with a p-value <0.05 was considered statistically significant.

