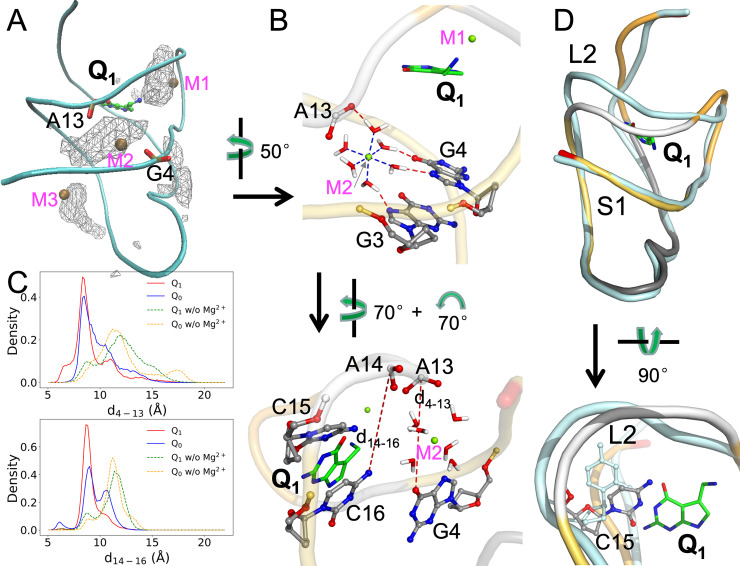
Fig 3. Distributions and effects of Mg2+.
(A) Density contours of Mg2+ ions in the Q1-bound complex, shown as wireframe. Three Mn2+ ions in PDB entry 6VUI are shown as ochre spheres; the corresponding Mg2+ sites are labeled as M1, M2, and M3. Phosphate groups in G4 and A13 are shown in stick representation, to highlight the bridging role of M2. (B) Two views showing the coordination of the Mg2+ ion at the M2 site. Top: coordination of Mg2+ by six water molecules and the latter’s hydrogen bonding with the G3 and G4 nucleobases and A14 phosphate. Bottom: two distances, d4-13 (between G4 O6 and A13 OP1) and d14-16 (between A14 P and C16 N4), introduced to characterize the effects of the Mg2+ ion. (C) Probability densities of d4-13 and d14-16, in cMD simulations with and without Mg2+ ions. (D) Effect of Mg2+ ions on the separation of the L2 loop from the S1 helix in the Q1-bound form. Two representative structures are superimposed, with the aptamer in the presence of Mg2+ shown in the same multi-color scheme as in Fig 1A and the aptamer in the absence of Mg2+ shown in a uniform cyan color. In the bottom view, the C15 nucleotides in the two structures are shown in a stick representation.

