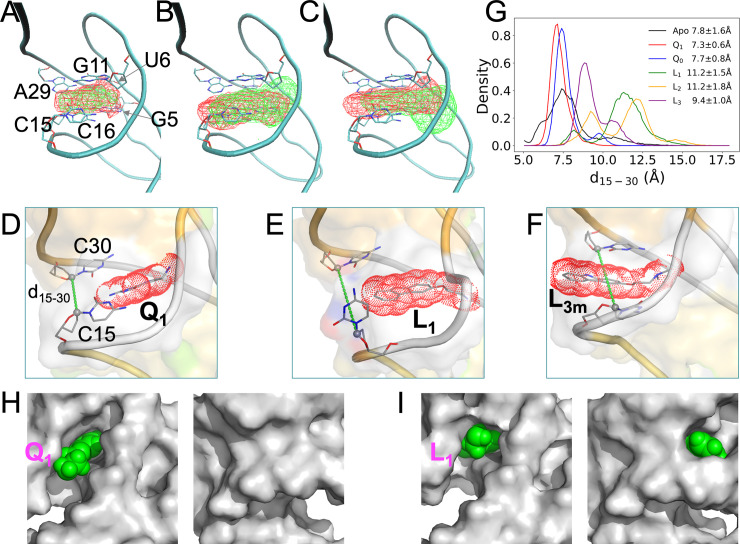
Fig 5. Loosening in the back of the binding pocket when bound with synthetic ligands, in cMD simulations with Mg2+.
(A)-(C) Density contours of ligands, shown as wireframe in reference to a representative Q1-bound structure, with the six pocket-lining nucleotides displayed in stick representation. Panel (A) shows contours in red for Q1 and in green for Q0; panel (B) shows contours in red for L1 and in green for L2; and panel (C) shows contours in red for L3m and in green for L3M. The L3m and L3M contours were calculated only from snapshots where hydrogen bonding with A29 or U6 was present. (D)-(F) Representative conformations of the Q1-, L1-, and L3m-bound forms, respectively. Ligands are shown in both stick representation and as dot surface. The C1’ atoms of C15 and C30 are connected to define the distance d15-30 and to illustrate the back door. (G) The probability densities of d15-30 in the apo form and the five liganded forms. (H) Two views into Q1 in the binding pocket. The aptamer is shown as gray surface while the ligand is shown as green spheres. Left: front view showing Q1 exposure; right: back view showing buried Q1. (I) Corresponding presentation for L1, except that this ligand is exposed both on the front and on the back.

