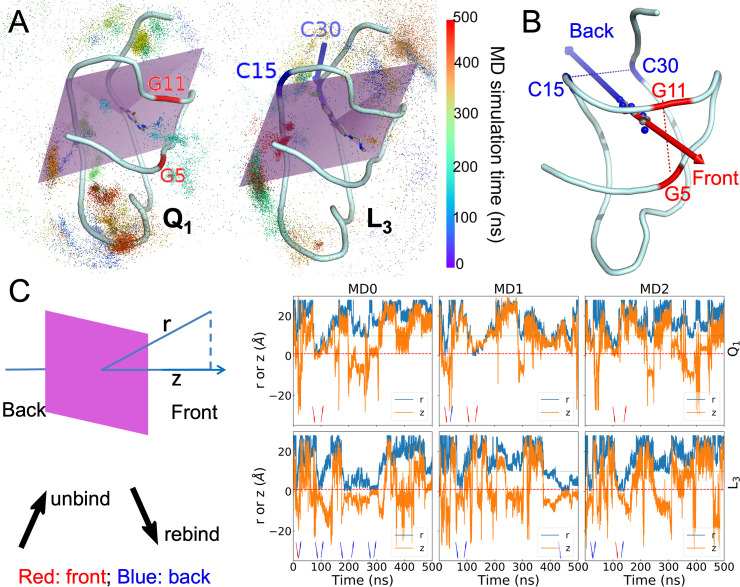
Fig 6. Unbinding and rebinding pathways of ligands.
(A) The trajectories of ligand centers shown as dots colored according to the MD simulation time. The aptamer and bound ligands are shown in cartoon and stick representations, respectively. Left: Q1; right: L3. A plane in purple bisects the binding pocket into the front half and the back half. Two nucleotides defining the front door in the Q1-bound complex are labeled in red; two nucleotides defining the back door in the L3-bound complex are labeled in blue. (B) The front and back unbinding paths. (C) The center-to-center distance r between the ligand and the binding pocket and the z coordinate of the ligand center along the normal of the pocket-bisecting plane. The left-most panel illustrates r and z, and presents interpretations of arrow directions and colors that appear in the right three panels, which show time traces of r and z in three metadynamics simulations. Red dashed and green dotted horizontal lines are drawn at r = 1 and 9 Å, respectively, to indicate the times of entrance to and exit from the binding pocket.

