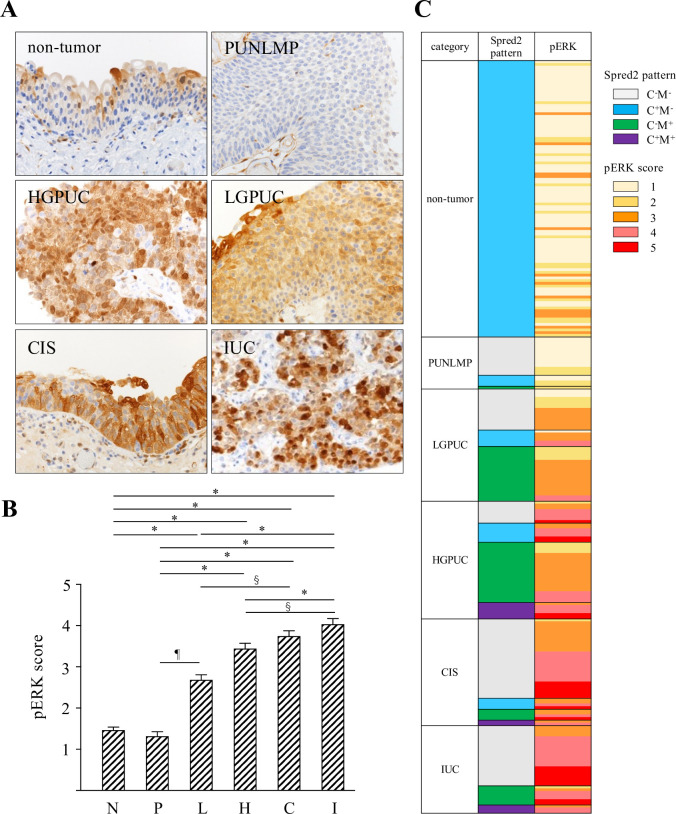
Fig 3. pERK score in urothelial tumors.
(A) Representative photographs of pERK immunohistochemistry (original magnification 400×) from each category are shown. (B) pERK staining intensity was evaluated and scored (0–5), and pERK score in each category was shown (N: non-tumor; n = 101, P: PUNLMP; n = 19, L: LGPUC; n = 41, H: HGPUC; n = 43, C: CIS; n = 39, and I: IUC; n = 32). Data were mean ± SEM. §p<0.01, ¶p<0.001, *p<0.0001 (Dunn’s multiple comparison test).

