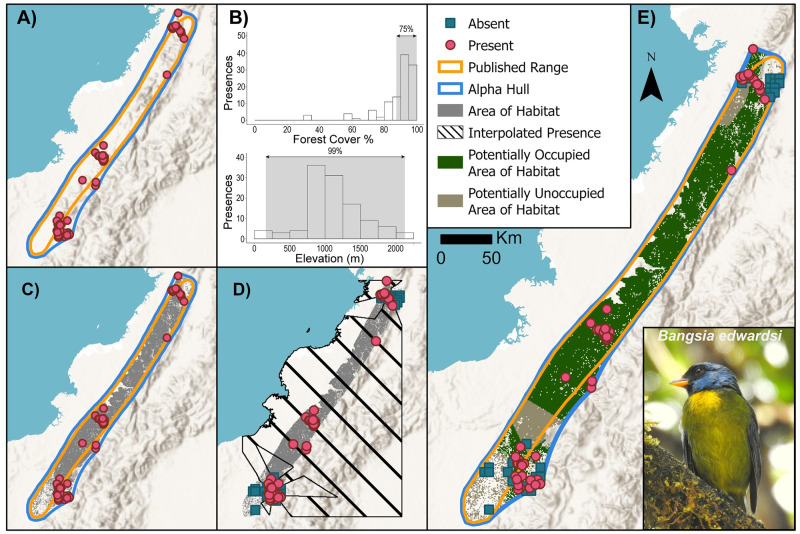
Fig 1. Overview of steps in creating a range map for moss-backed tanager Bangsia edwardsi.
(A) After compiling presence locations (pink dots) and the current published range (orange lines), the user creates an alpha hull (blue lines) using the median inter-presence distance for alpha. (B) Users determine the habitat and elevational requirements for each species using distributions of landcover data extracted at each presence. (C) The next step is to refine the alpha hull area by the elevational and habitat land cover to identify the Area of Habitat (grey shading). (D) Using absence data (blue squares) generated from an aggregation of checklists that record no presences of the species, the user runs a nearest neighbour interpolation to identify all pixels that are closer to a presence or an absence. (E) The Area of Habitat is then split into Potentially Occupied Area of Habitat (green shading) and Potentially Unoccupied Area of Habitat (brown shading) based on the interpolation of the previous results. Base map provided by USGS and photo provided by Cristian Florez Pai with permission.

