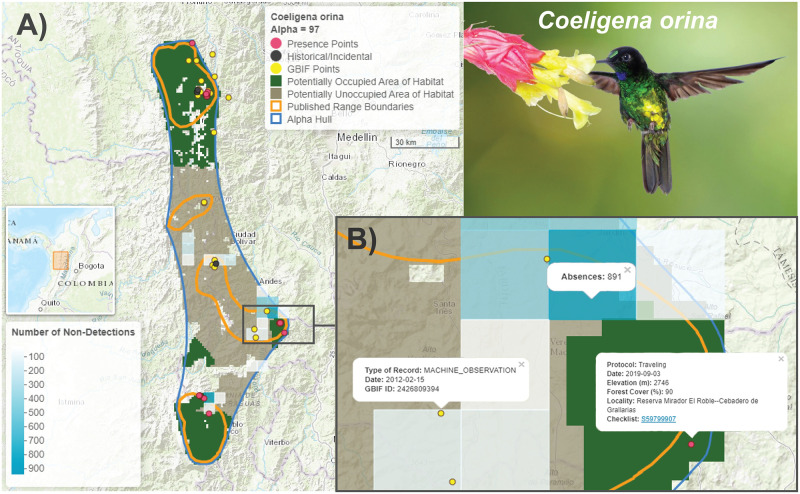
Fig 2. Example interactive range map for the glittering starfrontlet, Coeligena orina.
(A) A screenshot of the interactive HTML map created with the ‘leaflet’ package that shows the alpha hull (blue) generated from the union of the published range maps (orange polygons, [11]) and the eBird observations (pink dots). The shaded areas are the Area of Habitat, i.e. the alpha hull refined by elevational and canopy cover requirements. Potentially Occupied Area of Habitat (shaded green) represents areas closer to observations than absences (absences are defined as the aggregate of 25 or more checklists within a 5km × 5km cell that do not record the species, shaded in blue, see Methods). In contrast, Potentially Unoccupied Area of Habitat (shaded brown) represents areas closer to absences than observations. Also shown on the map are presence localities from the Global Biodiversity Information Facility (yellow dots) and historical/incidental records from eBird (black dots) that were excluded from the analysis due to inconsistent quality, but which may provide additional insights. (B) The interactive nature of these maps allows users to zoom in on details and interrogate the data by clicking on any point to see the underlying metadata such as date, elevation and forest cover, and links to the original eBird checklists, or by clicking on an absence square to see the number of non-detections. Basemap provided by ESRI and photo by Luis Mazariegos with permission.

