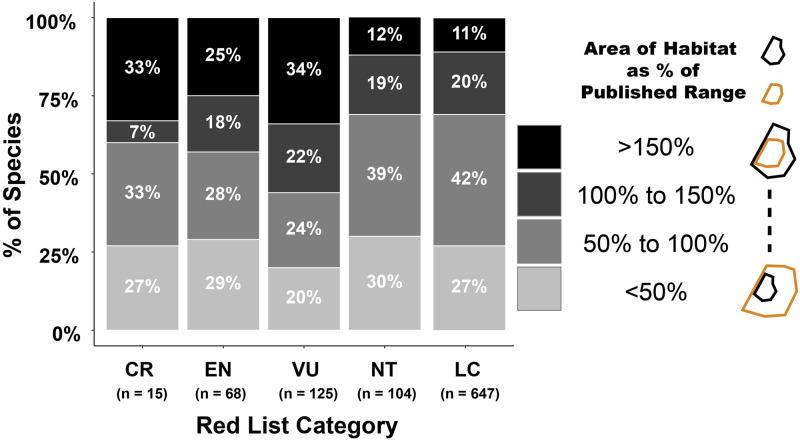
Fig 4. Area of Habitat estimates in relation to published range sizes for species in different IUCN Red List categories.
Bars show the proportions of Critically Endangered (CR), Endangered (EN), Vulnerable (VU), Near Threatened (NT), and Least Concern (LC) species with different percentage values for Area of Habitat divided by the published range. The lightest colours represent species with Area of Habitat that is less than 50% of the published range while the darkest colours represent species with Area of Habitat more than 150% larger than the published range size. Black polygons represent Area of Habitat and gold polygons represent published ranges.

