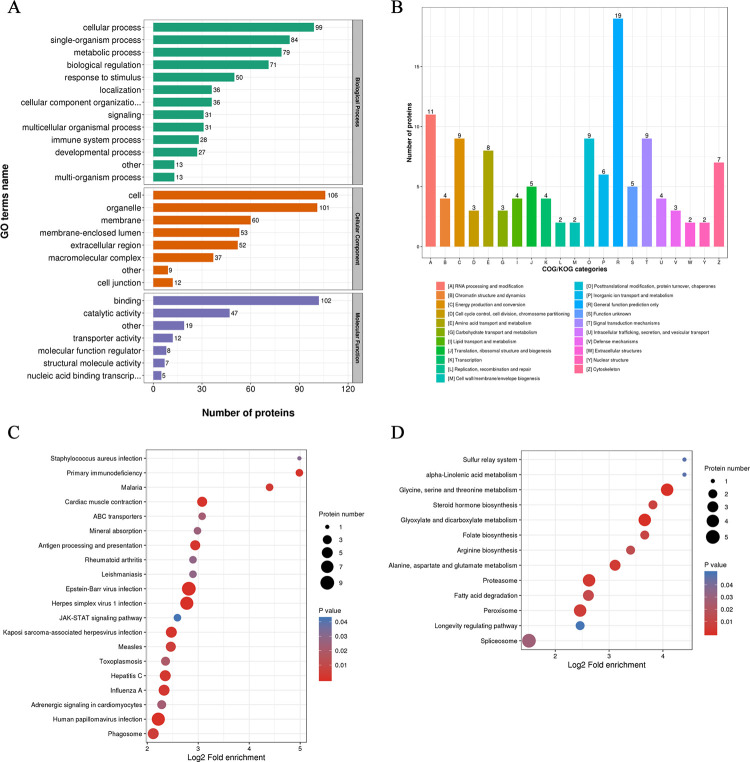
Fig 2. Bioinformatic characterization of the DEPs in host cells.
(A) GO classification of DEPs according to their associated biological process, cellular component, and molecular function terms. (B) COG/KOG functional classification of DEPs. (C) KEGG pathways enrichment analysis of the upregulated proteins. (D) KEGG pathways enrichment analysis of the downregulated proteins. The color represents the significance P-value of enrichment. The size of the circle represents the number of proteins involved.

