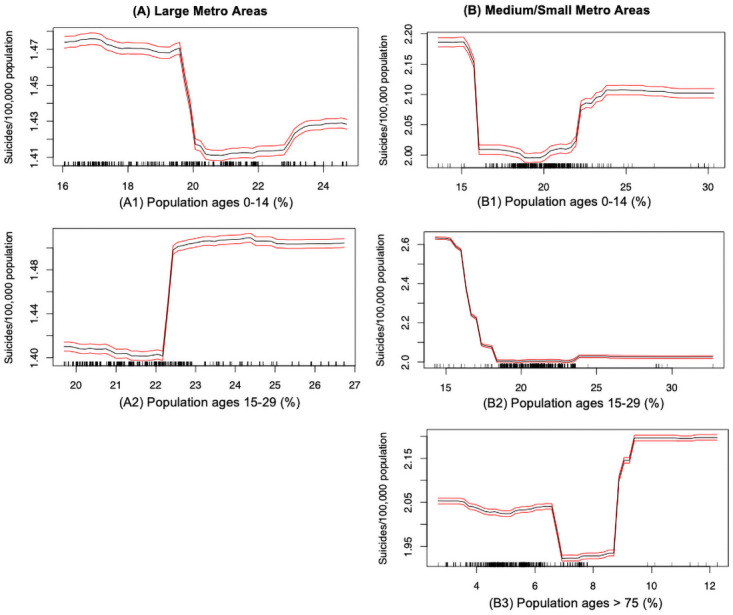
Fig 8. Suicide mortality rate and age: (A) Large metro areas; (B) Medium/small metro areas.

Rug lines on the x axis indicate prevalence of data points; black curve is the average marginal effect of the predictor variable; red lines indicate the 95% confidence intervals.
