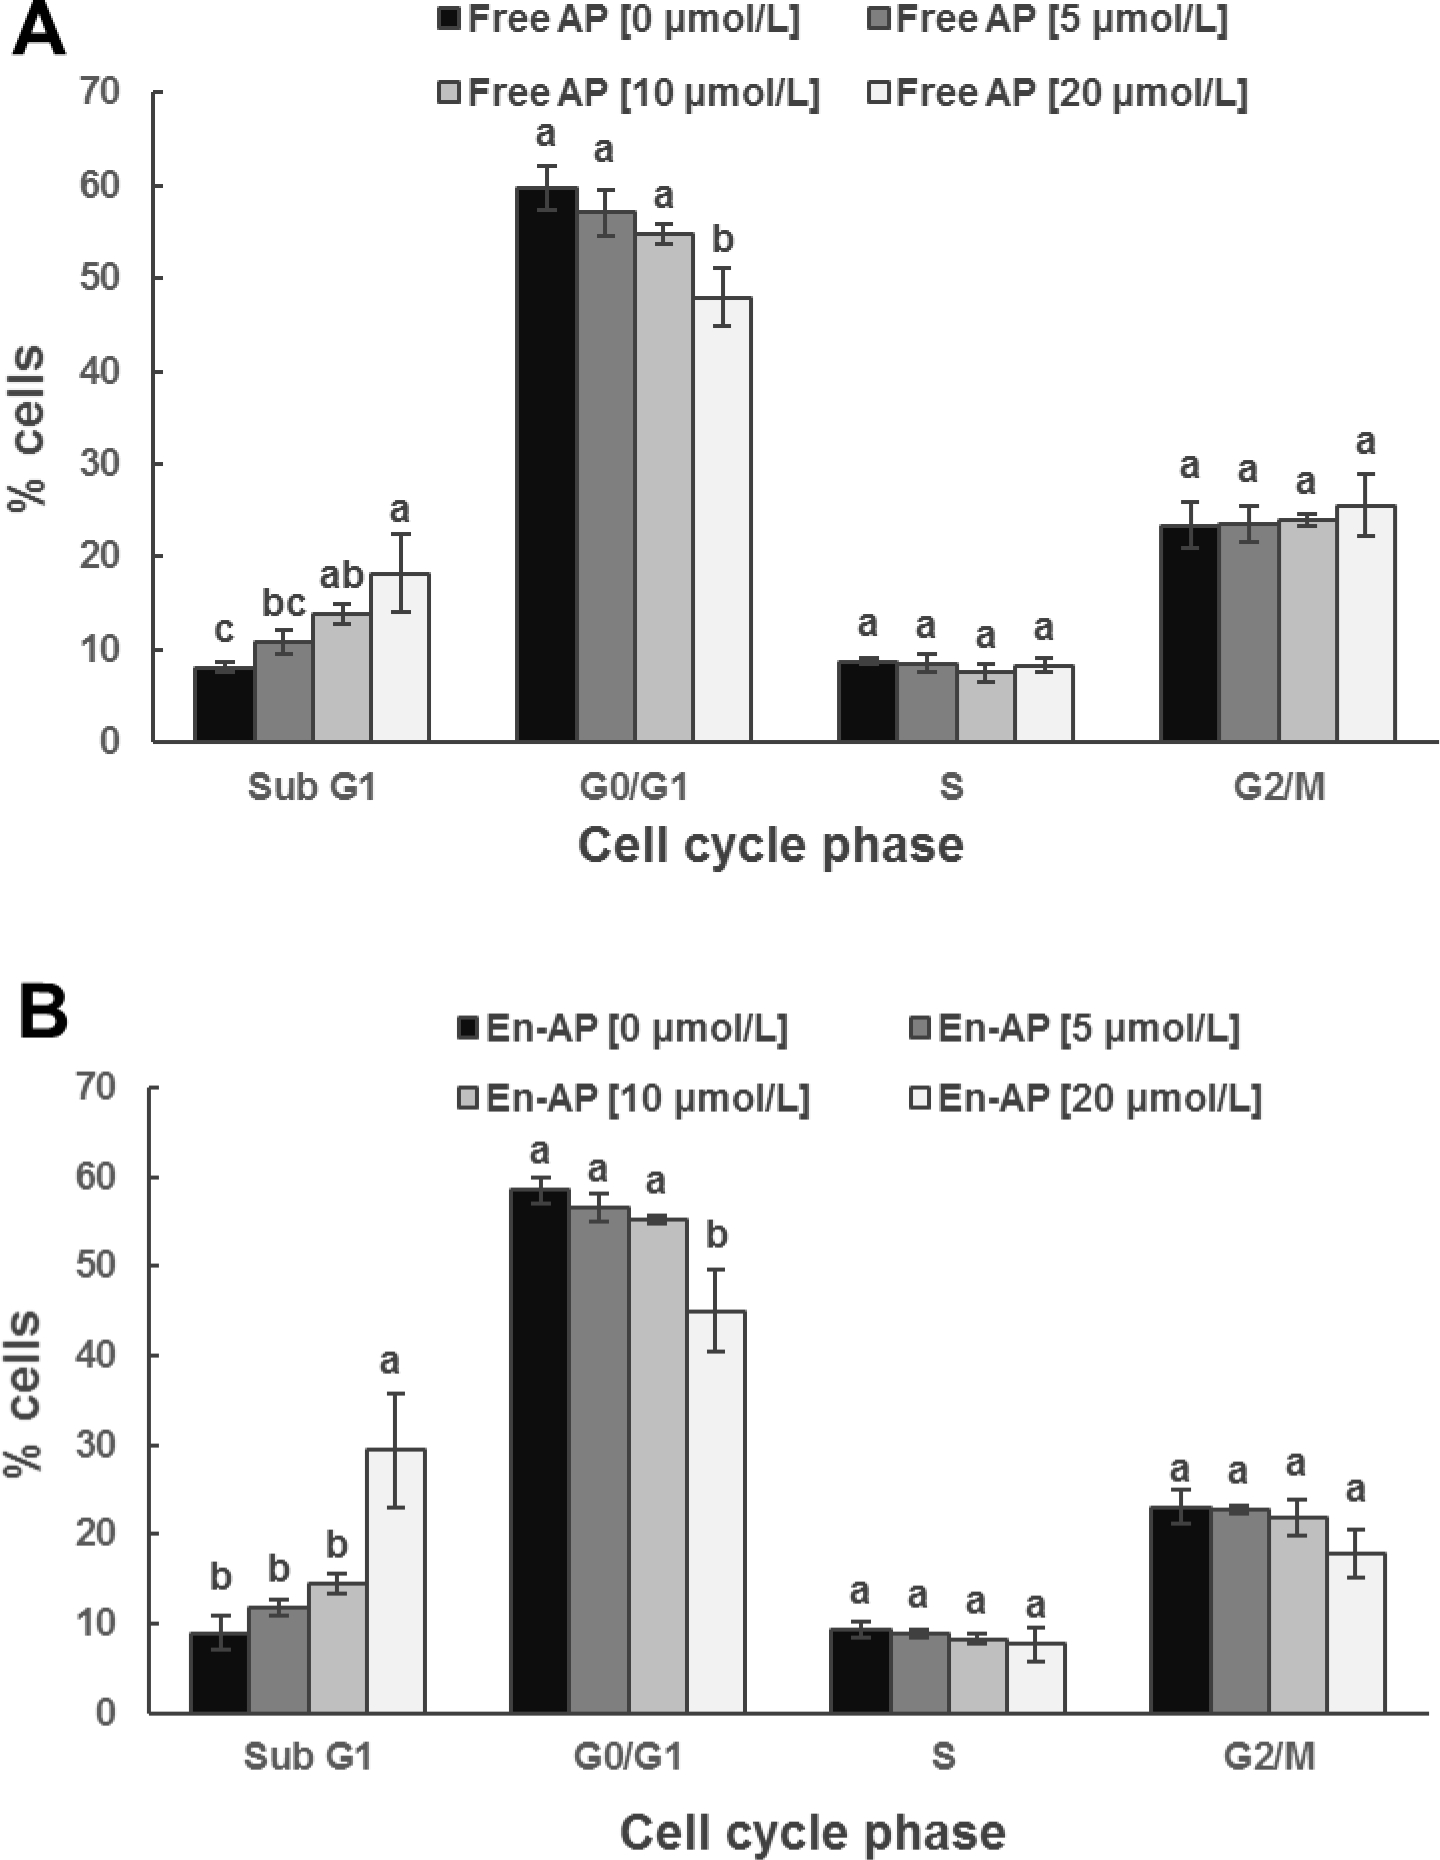
Figure 7.

Cell cycle distribution analyzed with flow cytometry for HT-29 cell line after treatment with 0, 5, 10, and 20 μmol/L apigenin (AP) pre-dissolved in DMSO (Free AP, A) or nanoencapsulated in WPI (En-AP, B) for 24 h at 37 °C. The En-AP was prepared with 10.0 mg/mL WPI and 2 mg/mL AP using the pH-cycle. Error bars are SD (n = 3). Mean values with different letters within the same cell cycle phase are significantly different (p < 0.05).
