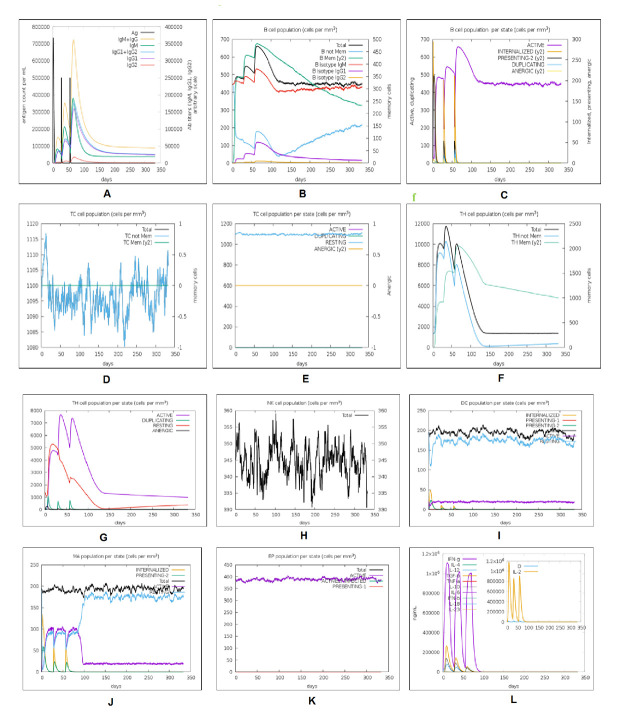
Figure 15.
In silico immune response simulation of the positive control (C1) through C-ImmSim program. A) Elevation of immunoglobulins at different concentration of antigen, B) Population of B lymphocytes (IgM, IgG1 and IgG2) after three injections, C) population of B cell per entity-state (i.e., showing counts for active, presenting on class-II, internalized the Ag, duplicating and anergic by the different color variant. D) Amount of Cytotoxic T lymphocytes population, E) Cytotoxic T lymphocytes population in different states; resting and active. F) Total count of TH cell population along with memory cells, and sub-divided in isotypes IgM, IgG1, and IgG2. G) Population per entity-state of Helper T-cell count in the resting and active states. H) Population of Natural Killer cells. I) Population of Dendritic cells in the active and resting states. J) Population of Macrophages. K) Total count of EC cells that are broken down to active, virus-infected, and presenting on class-I MHC molecule. L) Concentration of cytokines and interleukins with Simpson index.

