Figure 2.
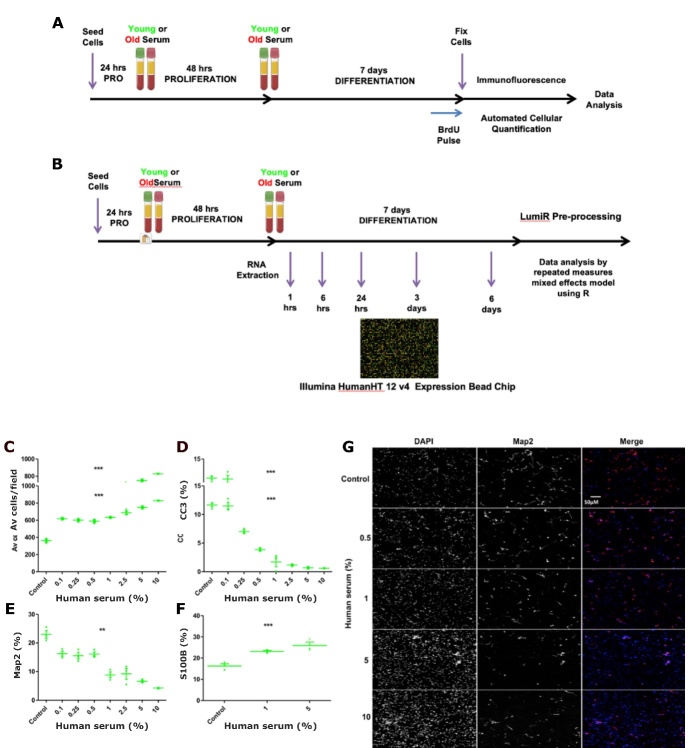
Serum assay timeline and optimal serum concentration. (A) Optimised assay timeline to evaluate the impacts of the human systemic environment on human. (B) Experimental timeline for qPCR and whole-genome expression analysis by microarray. (C-G) Human serum concentration dose-response curves for the differentiation phase of the assay. Culturing human hippocampal progenitors with increasing concentrations of serum (as a percentage on the x axis) increased (C) cell number, reduced (D) apoptotic cell death (CC3 as % of total cells) (E) immature neurons as measured (Map2 as % of total cells), and increased (F) astrogliogenesis (S100β as % of total cells). (G) Representative images of a dose-dependent decrease in Map2 staining (red fluorescence), also highlighting the increase in cell number through DAPI staining of cell nuclei. n = 3, using serum from a young male (aged 23 years). one-way ANOVA conducted across all concentrations (post-hoc comparisons not presented), ** P < 0.001, *** P < 0.001. Error bars = SEM. Scale bar applicable to all images.

