Figure 1.

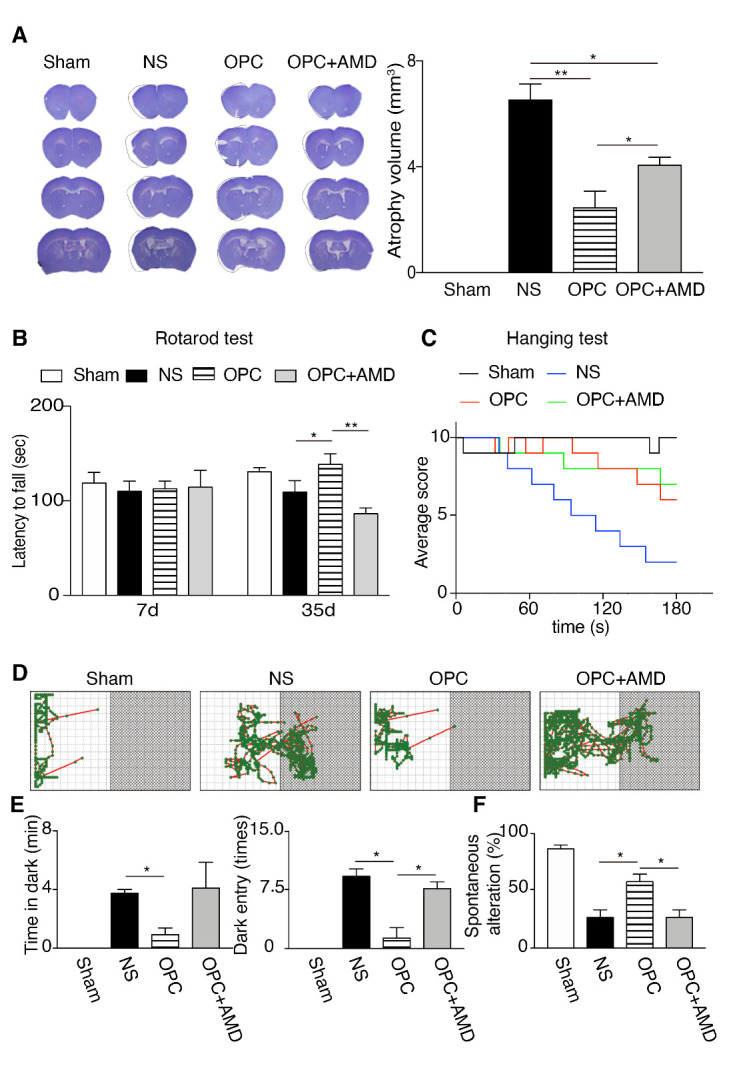
OPCs transplantation at 7 days after tMCAO reduced brain atrophy volume and promoted functional recovery of mice at 5 weeks after tMCAO. (A) Representative photos and quantification result of brain coronal sections stained with cresyl violet at 5 weeks after tMCAO. Sham (n=5), NS (n=8), OPC (n=8), and OPC+AMD (n=8). The black lines in the photos are the tracing of the contralateral hemisphere onto the ischemic hemisphere. (B) The result of rotarod test at 7 days and 35 days after tMCAO. Sham (n=8), NS (n=13), OPC (n=13), OPC+AMD3100 (n=13). (C) The result of hanging wire test at 35 days after tMCAO. Sham (n=8), NS (n=13), OPC (n=13), OPC+AMD3100 (n=13). D, The locomotion trajectories of mice for the passive avoidance test. (E) The time in dark zone and the numbers of dark-zone entering were summarized in the bar graphs in Sham (n=8), NS (n=13), OPC (n=13), OPC+AMD (n=13) groups. (F) The result of T-maze test in Sham (n=8), NS (n=13), OPC (n=13), OPC+AMD (n=13) groups. Data are presented as means ± SEMs, *p <0.05, **p <0.01. NS: tMCAO mice receiving normal saline, OPC: tMCAO mice receiving OPCs transplantation, OPC+AMD: tMCAO mice receiving OPCs and AMD3100.
