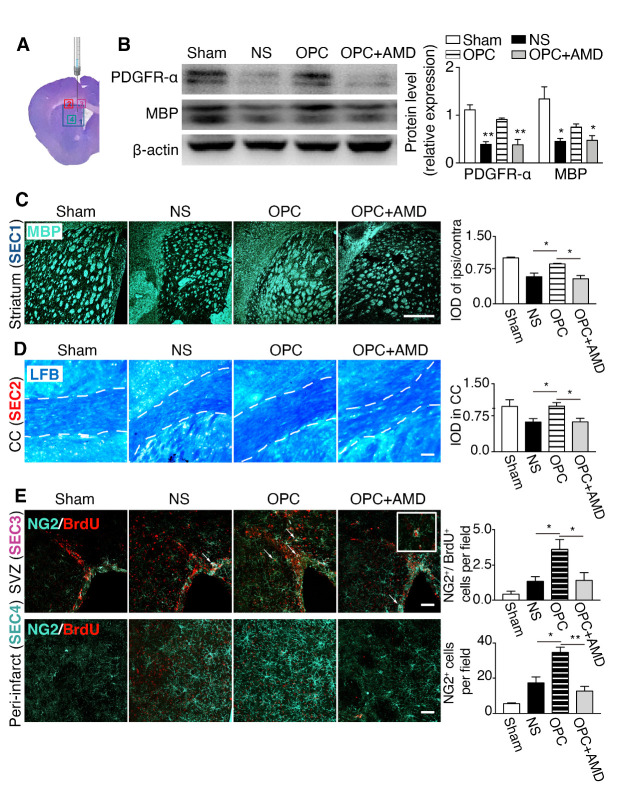
Figure 3.
OPCs protected myelin sheath integrity and promoted the proliferation of endogenous OPCs, and migration of OPCs. (A) The ipsilateral photo of brain coronal section stained with cresyl violet at 5 weeks after tMCAO illustrates the regions of interest imaged in sections. (B) The Western blot results of PDGFR-α and MBP in the ischemic striatum (n=3/group). *p <0.05, **p <0.01 compared with the OPC group. (C) Photomicrographs of MBP (light blue) in the striatum and the quantification of MBP IOD. (D) LFB myelin staining (blue) in the corpus callosum and the quantification data (n=3/group). The boarder of corpus callosum is outlined by the dotted lines. (E) Images of NG2 (light blue) and BrdU (red) staining in the SVZ and periinfarct area of striatum. Arrows indicating NG2+/BrdU+ newborn OPCs. The inset at the right corner is the magnified image of a NG2+/BrdU+ cell. Bar graphs are quantifications of NG2+/BrdU+ cells in the SVZ and NG2+ OPC cells that migrated to the periinfarct area (n=3/group). Scale bar, 50 μm. Data are presented as means ± SEMs, *p <0.05, **p <0.01. IOD: integrated optical density, LFB: luxol fast blue, CC: corpus callosum, SVZ: subventricular zone.

