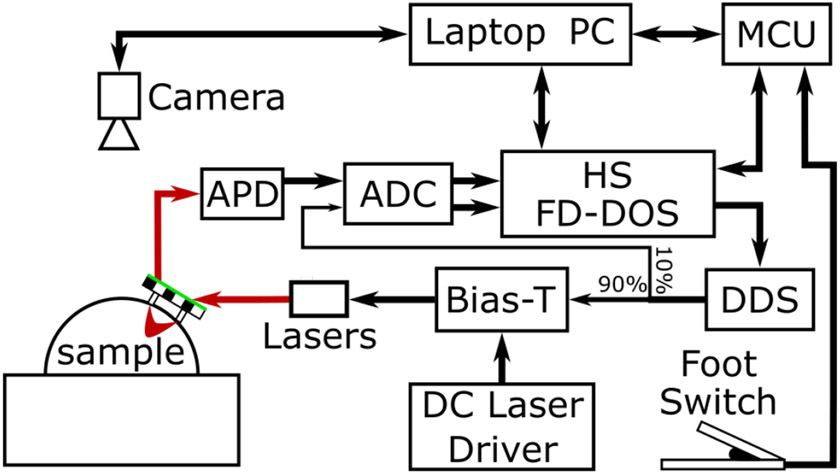
Fig. 1.
Block diagram of the real-time FD-DOS system. A probe consisting of a source optical fiber and a detector optical fiber along with a green outlined checkerboard target was moved freely over the surface of a sample. During measurements, this target was imaged by an overhead camera (FLIR Blackfly, 1.3 MP). These images were used to calculate the location of the source and detector fibers on the surface of the sample. FD-DOS measurements were performed by the HS FD-DOS system. This system was used to control 5 Direct digital synthesis (DDS) chips which generated radio frequency modulation signals. These signals were combined with a constant drive current using Bias-Ts and used to modulate the laser diodes. Optical signal was detected by an avalanche photodiode (APD) and the resulting electrical signal was digitized by a 250 MHz analog to digital converter (ADC). Measurements were triggered using a foot switch so the operator could have both hands free for collecting measurements. A microcontroller (MCU) was used to monitor the state of the foot switch as well as synchronize FD-DOS measurement and probe location calculations.

