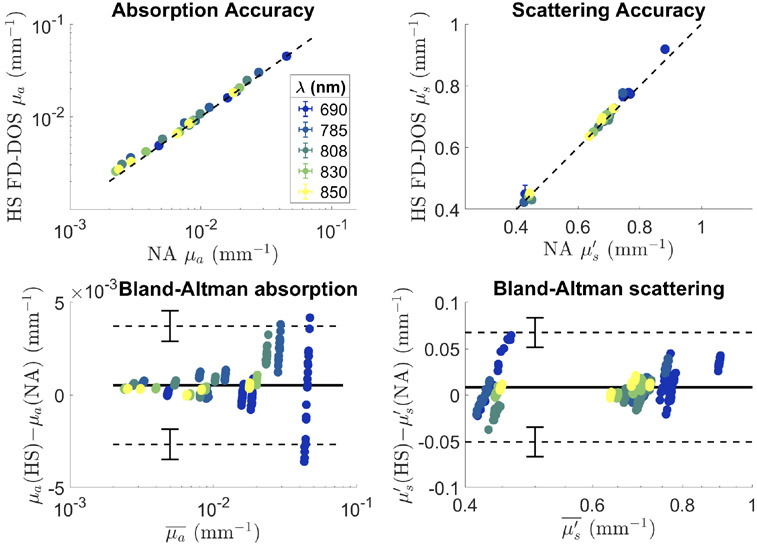
Fig. 4.
Top: Accuracy of absorption (left) and reduced scattering coefficient (right) for the high-speed FD-DOS (HS FD-DOS) system and the network analyzer (NA) based system. Points represent the average values for 20 repeated measurements. Error bars indicating ± one standard deviation are mostly smaller than the points used to indicate the mean values. Bottom: Bland-Altman plots for absorption (left) and reduced scattering coefficient (right). Solid horizontal lines show the average difference between measurements while the dashed lines show the limits of agreement between the two systems. Error bars on the dashed lines show the 95% confidence interval for the location of the limits of agreement. HS stands for the high-speed FD-DOS system while NA stands for the network analyzer based system. μa values are shown on a logarithmic scale.

