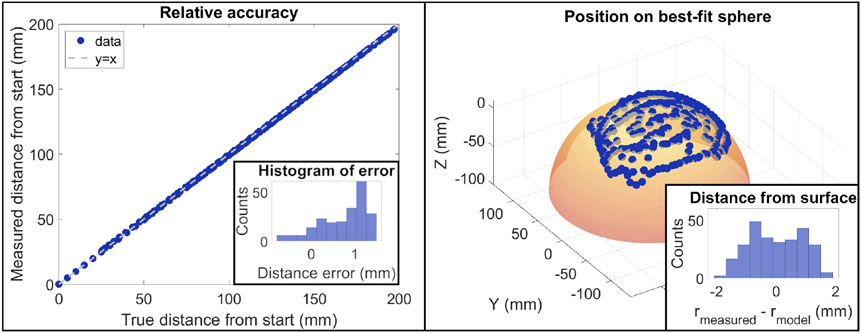
Fig. 5.
Left: Relative tracking accuracy. A linear stage was used to move the probe to 217 known locations. The true distance of each point from the first location is plotted on the X-axis and the measured distance from the first location is plotted on the Y axis. Inset into this plot is a histogram of the difference between the known and measured locations. The average error was 0.7 ± 0.5 mm. Right: The probe was randomly scanned over the surface of a sphere and the recorded coordinates are displayed as points. A best-fit sphere was constructed based on those locations to ensure the points followed a spherical shape. Inset into this plot is a histogram of the measured distance from the sphere center at each point minus the radius of the best-fit sphere. The deviation from the model was 0.0 ± 0.9 mm.

