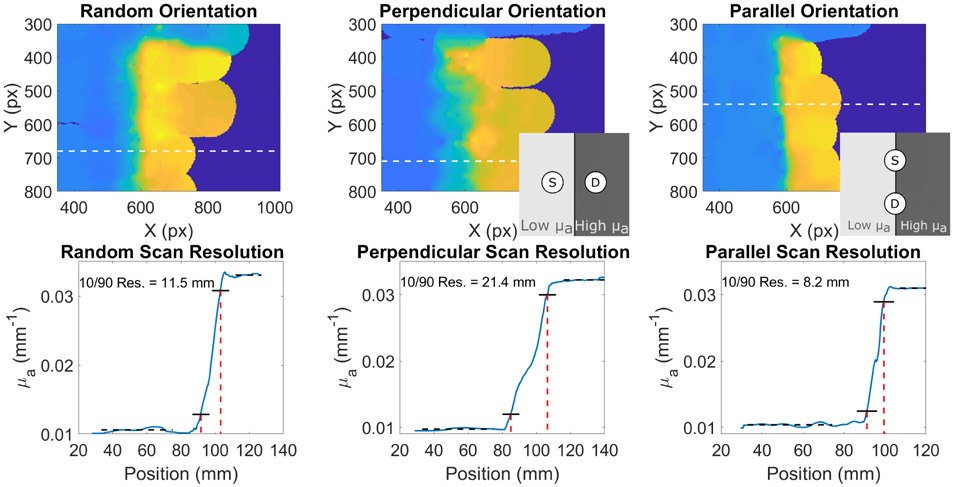
Fig. 7.
HS FD-DOS images of a phantom with a step discontinuity. The top row shows images of the phantom with the optical fibers of the probe oriented at random (left) perpendicular to the discontinuity (center), and parallel to the discontinuity (right). Insets in the middle and right images show a schematic of the position of the fibers relative to the discontinuity. The bottom row shows profiles of the locations indicated by dashed white lines. Black dotted lines show the constant region before and after the discontinuity. Solid black lines show the level of 10% of the change and 90% of the change. Dashed red lines show the positions of the 10% and 90% levels. The distance between the 10% and 90% absorption coefficients are notated in each image.

