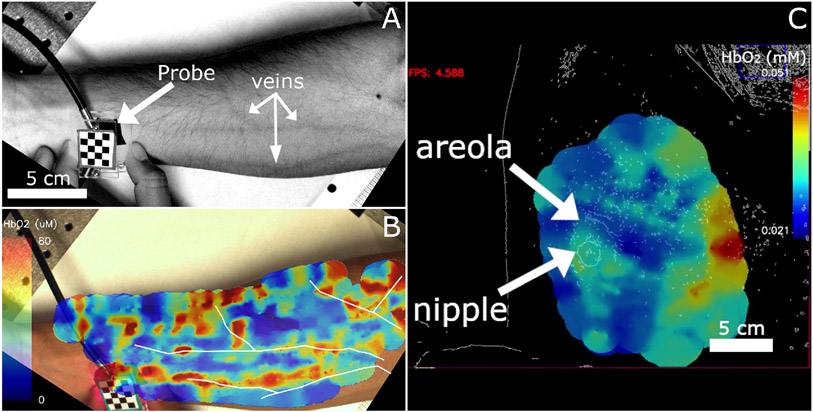
Fig. 8.
A. Grayscale camera image with enhanced contrast showing superficial blood vessels. The probe is also indicated in the image B. Still image from a video showing oxyhemoglobin measurements made with a source-detector separation of 5 mm overlaid on an image of the forearm seen in panel A. White outlines indicate the paths of superficial blood vessels visible in panel A which were then overlaid on panel B such that they overlapped with regions of high oxy-hemoglobin concentrations. This image was produced after the measurements occurred and the color scale adjusted to highlight vessel-like structures. C. Still image from a screen capture of a measurement on a healthy breast displaying calculated oxy-hemoglobin concentration. Breast images from healthy volunteers were passed through an edge-detection filter prior to being displayed to preserve patient privacy. The nipple and areola region of the right breast are indicted by arrows show higher oxyhemoglobin concentration than the surrounding breast tissue. Higher concentrations on the right side of the image (medial) are likely due to the effect of underlying muscle or bone.

