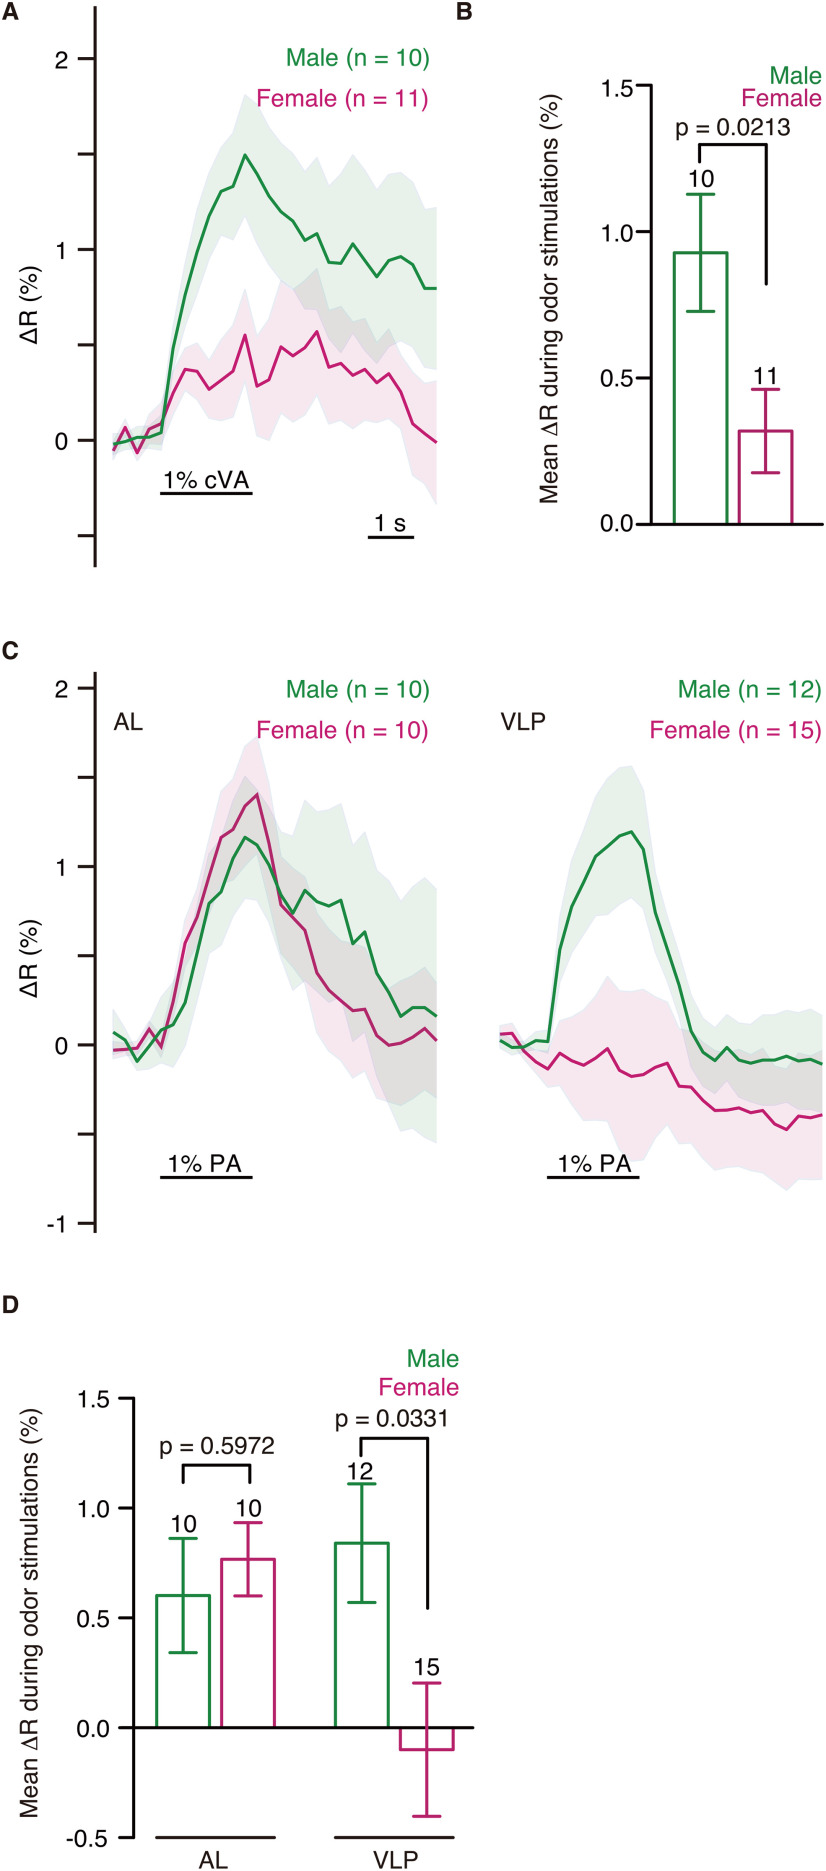
Figure 2.
Sexual dimorphism in the odor response patterns of lPN4. A, Calcium responses of lPN4s to 1% cVA in the antennal lobe. Horizontal bar represents the odor stimulations. Shading indicates the SEM. B, Mean ΔR during cVA stimulations. C, Calcium responses of lPN4s to 1% palmitoleic acid (PA) in the antennal lobe (AL, left) and ventrolateral protocerebrum (VLP, right). D, Mean ΔR during the 1% PA stimulations in the AL and VLP. Mean ΔR during the odor stimulations was compared using unpaired two-tailed t test. Error bars indicate the SEM. Numbers above error bars represent the numbers of animals observed.

