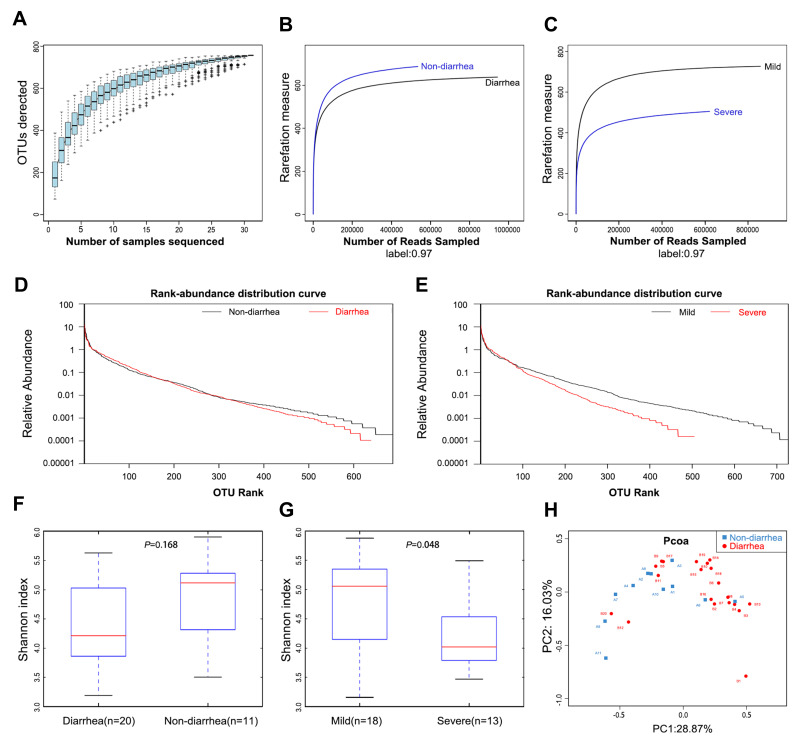
Figure 1.
Gut microbiota diversity in patients (n=31). (A) Species accumulation curves became flatter as the sample size increased, indicating that the sample size of this study is adequate. (B) The estimated OTUs richness was significantly decreased from the non-diarrhea group (n=11) to the diarrhea group (n=20). (C) The estimated OTUs richness was significantly decreased in the severe group (n=13). (D) Rank-abundance distribution curves analysis showed that the relative abundance of the diarrhea group was lower than that of the non-diarrhea group. (E) The relative abundance of the severe group decreased compared with the mild group. (F) Gut microbial diversity in the diarrhea group was lower than that in the non-diarrhea group by Shannon analysis. (G) Gut microbial diversity was significantly higher in the severe group than that of in the mild group (p=0.048). (H) PCoA analysis indicated a symmetrical distribution of fecal microbial community among all the samples.
Abbreviations: OTUs, Operational Taxonomic Units; Boxes represent the interquartile ranges, lines inside the boxes denote medians; PCoA, principal coordinates analysis.

