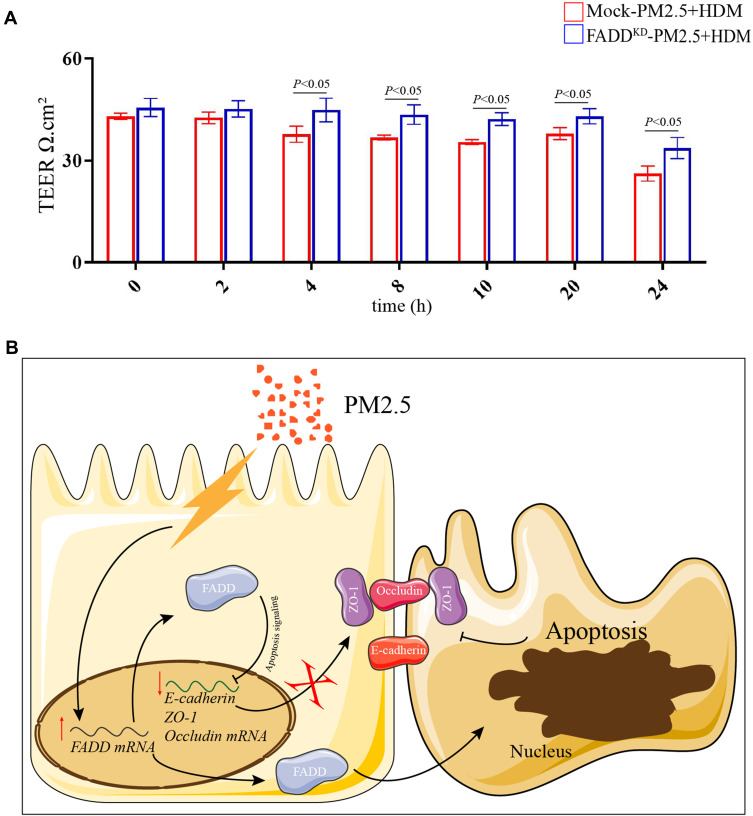
Figure 6.
TEER value and Schematic model. (A) TEER value in Mock and FADD knock-down cells after PM2.5 plus HDM treatment at different time-points. (B) Schematic model, PM2.5 exposure increased the transcript and protein levels of FADD. On one hand, the increased FADD inhibited the transcript levels of ZO-1, Occludin and E-cadherin through apoptosis signaling, which decreased the protein levels of ZO-1, Occludin and E-cadherin. On the other hand, the increased FADD aggravated apoptosis. Eventually, tight junction was disrupted by PM2.5.

