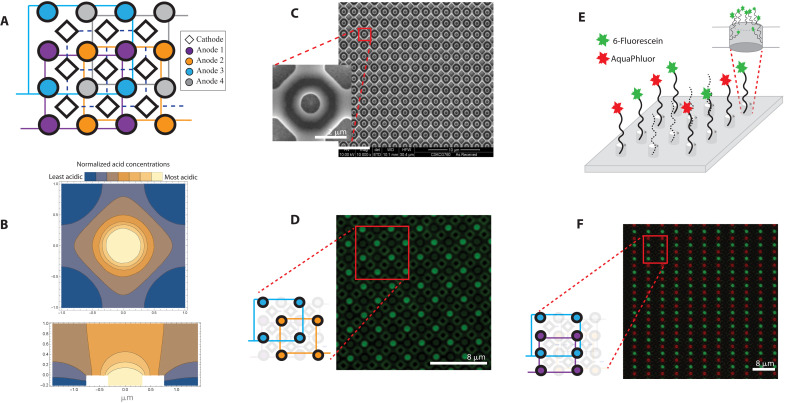
Fig. 2. Overview of 650-nm array pitched 2 μm.
(A) Finite element analysis of anodic acid generation and diffusion at a 650-nm-diameter electrode with a 200-nm well is depicted with a cross-sectional view along the y = x plane and (B) top-down view on the z = 0 plane. The colors blue and yellow represent regions with relatively low and high acid concentrations, respectively. (C) An overview of the nanoscale DNA synthesis array with scanning electron microscopy images of the 650-nm electrode array and enlarged view of one electrode. (D) A fluorescent image in which the well surrounding each activated anode is patterned with AAA-fluorescein. The cartoon diagram depicts which electrodes in the layout were activated. (E) Illustration of the wells patterned with AAA-fluorescein and AAA-AquaPhluor and (F) corresponding image overlay of the two fluorophores at the end of DNA synthesized on the same 650-nm electrode array.

