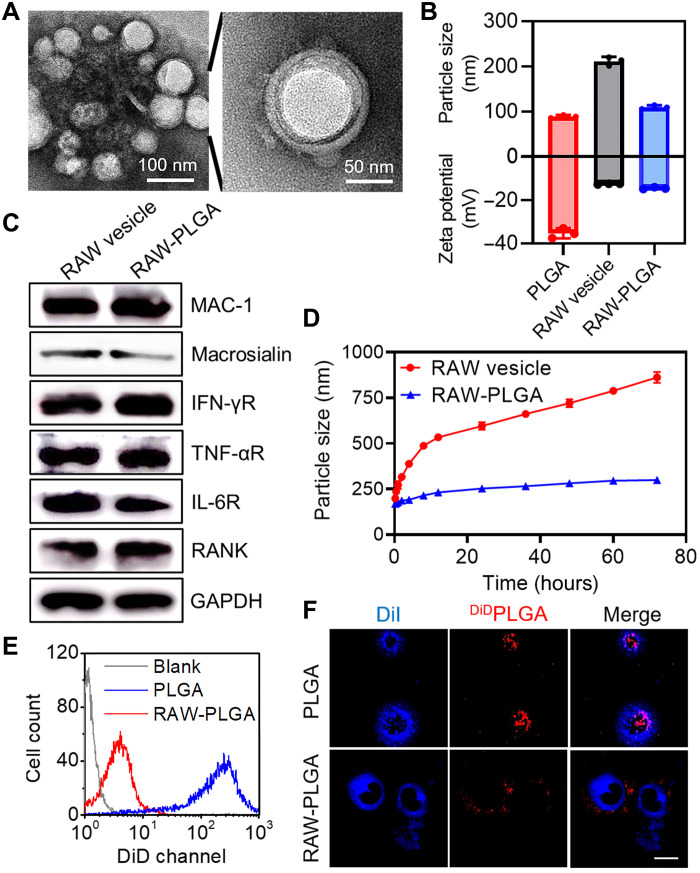
Fig. 2. Characterization and decreased macrophage uptake of RAW-PLGA nanodecoys.
(A) TEM images of RAW-PLGA nanodecoys. (B) Size and zeta potential of PLGA NPs, RAW vesicles, and RAW-PLGA nanodecoys (n = 3). (C) Characteristic protein bands of RAW vesicles and RAW-PLGA nanodecoys resolved by Western blot. (D) Size alteration of RAW vesicles and RAW-PLGA nanodecoys after incubation in DMEM containing 10% FBS for different times (n = 3). Flow cytometric diagrams (E) and CLSM images (F) of RAW 264.7 cells following 4-hour incubation with DiDPLGA NPs and RAW-DiDPLGA nanodecoys (100 μg DiDPLGA/ml). The cell membrane was stained with DiI (scale bar, 10 μm).

