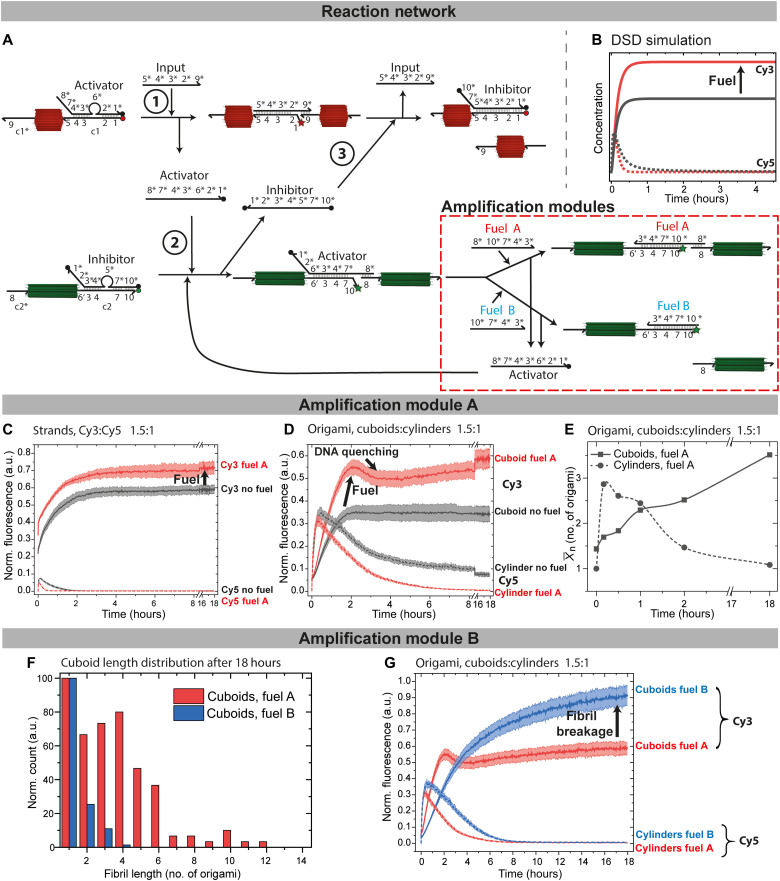
Fig. 5. Signal amplification modules and end point regulation of the cuboid assembly.
(A) Scheme of the DSD cascade with the amplification modules. Fuel A displaces the activator while keeping cuboid fibrils intact. Fuel B depolymerizes the cuboid fibrils. (B and C) DSD simulation and experimental implementation of the fueled DSD circuit with (red) or without (black) fuel A. DSD predicts the behavior of the unquenched Cy3 species (solid lines) and unquenched Cy5 species (dotted lines), while the time-resolved normalized fluorescence confirms the behavior. c1/activator, c1*, input at 160 nM, inhibitor/c2, c2*, fuel A at 240 nM. (D) Time-resolved normalized fluorescence of the origami system: 15 nM functionalized cuboids (16c) and 10 nM functionalized cylinders (16c) at 160 nM input in the presence of 240 nM fuel A (red) and without fuel (black). (E) for the DSD cascade with fuel A. Lines are Bezier curves. (F) Statistical TEM image analysis of cuboid fibril length distribution after 18 hours with 80 nM fuel A (red) or 480 nM fuel B (blue) using 15 nM cuboids and 10 nM cylinders. (G) Time-resolved normalized fluorescence comparing the effect of fuel A versus fuel B [conditions as in (D)]. All fluorescence measurements are an average of at least 2; the shaded area is the SD.

