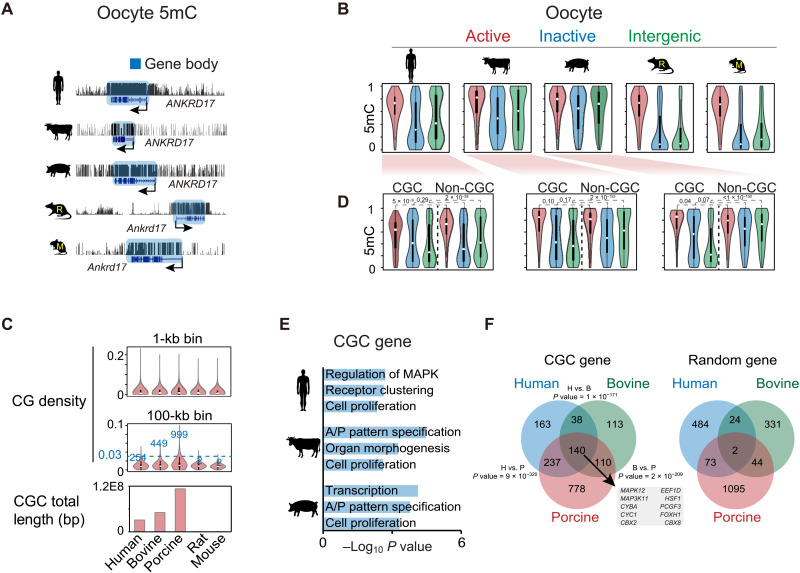
Fig. 2. Oocyte DNA methylomes and CpG continents.
(A) The UCSC genome browser views showing DNA methylation at the ANKRD17 loci in mammalian oocytes. (B) Violin plots showing the DNA methylation levels in active gene bodies (red), inactive gene bodies (blue), and intergenic regions (green) in mammalian oocytes. (C) Violin plots showing the CG density in the genomes of different species. Top: CG density in 1-kb bins. Middle: CG density in 100-kb bins. The numbers of 100-kb bins with density more than 0.03 are shown. Bottom: Barplot showing the total CGC lengths in the genomes of the five species. (D) Violin plots showing the DNA methylation levels in active gene bodies (red), inactive gene bodies (blue), and intergenic regions (green) in CGC and non-CGC regions in human, bovine, and porcine oocytes. P values (Wilcoxon test) are also shown. (E) Barplot showing the enriched Gene Ontology (GO) terms for genes in CGCs in human, bovine, and porcine. A/P, anterior/posterior. (F) Venn diagram showing the overlap of orthologous genes in CGCs among human, bovine, and porcine. The P value (Fisher’s exact test) of shared genes for each species pair and overlapped genes among all three species are shown. The overlaps of random genes of equal numbers as CGC genes are also shown.

