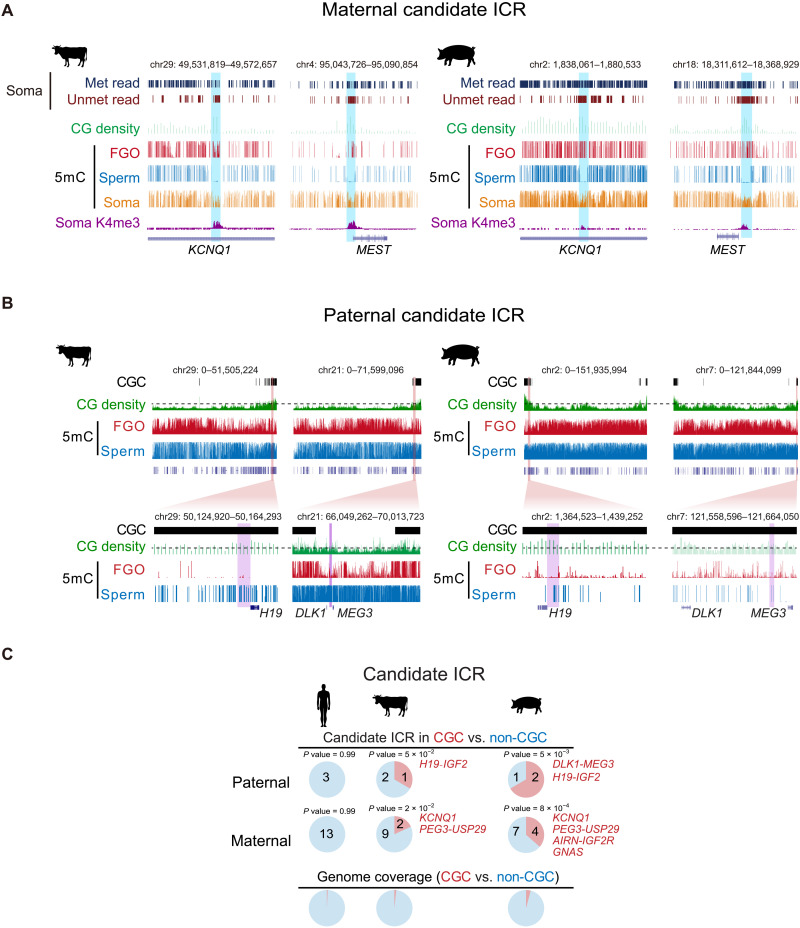
Fig. 3. Enrichment of imprinted ICRs in CGCs in bovine and porcine.
(A) The UCSC genome browser views showing the locations of putative KCNQ1 and MEST ICRs in bovine and porcine. The sequenced reads with all CpGs (at least three) fully methylated (Met read) and fully unmethylated (Unmet read) in somatic tissues (Soma) [bovine, lung (74); porcine, muscle (78)], CG density (1-kb bin), DNA methylation (5mC) in oocyte, sperm [data are from (79) for bovine and (16) for porcine] and somatic tissues, and H3K4me3 (K4me3) in somatic tissues (CCs for both bovine and porcine) are shown. (B) The UCSC genome browser views (whole chromosome and zoomed-in) showing the chromosome end proximal localization of the putative paternal gICRs (purple shaded) H19-IGF2 and DLK1-MEG3 in CGC regions of bovine and porcine oocytes. CG density (1-kb bin) and DNA methylation in FGOs and sperm are also shown. The dashed lines for CG density indicate the cutoff of 0.03 (100-kb bin) used for calling CGCs. (C) Pie charts showing the percentages of paternal (top) and maternal (middle) gICRs located in CGC and non-CGC regions for human, bovine, and porcine. The genome coverages of CGC and non-CGC are shown as controls (bottom). P values (Fisher’s exact test) are also shown. Note the DLK1-MEG3 ICR is surrounded by CGCs in bovine.

