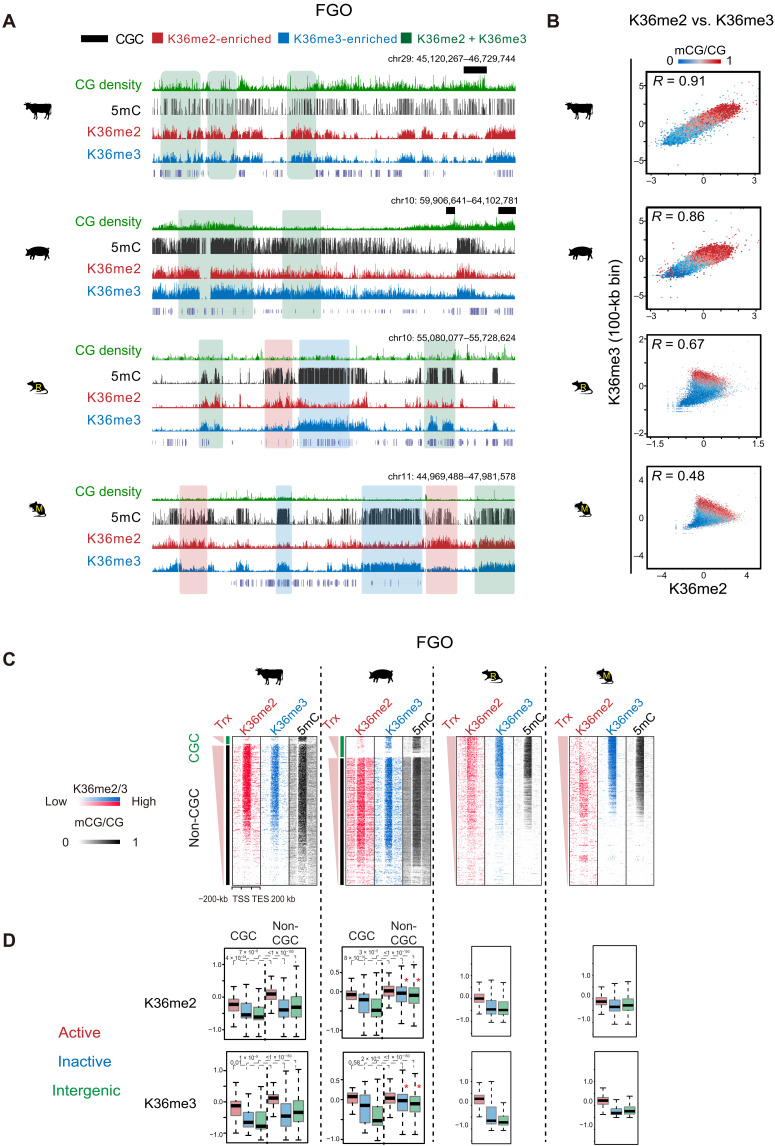
Fig. 4. The relationship of H3K36me2, H3K36me3, and DNA methylation in FGOs across mammals.
(A) The UCSC genome browser views showing DNA methylation, H3K36me2, and H3K36me3 enrichment in nonhuman FGOs. Regions covered by substantial H3K36me2 (K36me2-enriched), H3K36me3 (K36me3-enriched), and both marks (K36me2 + K36me3) are shaded in red, blue and green, respectively. CGCs are also shown in bovine and porcine. (B) Scatterplots comparing H3K36me2, H3K36me3, and DNA methylation in FGOs of all four species. DNA methylation levels in each bin are color-coded. The Pearson correlation coefficients are shown. (C) Heatmaps showing the enrichment of H3K36me2, H3K36me3, and DNA methylation in gene bodies and the flanking regions in FGOs of bovine, porcine, rat, and mouse. For bovine and porcine, CGC and non-CGC regions are separately shown. Genes are sorted by FPKM. Trx, transcription. (D) Boxplots showing the enrichment of H3K36me2 (top) and H3K36me3 (bottom) in active gene bodies (red), inactive gene bodies (blue), and intergenic regions (green) in the oocytes among the four species. CGC and non-CGC regions are separately shown for bovine and porcine. P values (Wilcoxon test) are also shown. Note that both H3K36me2 and H3K36me3 show high enrichment in inactive gene bodies and intergenic regions in non-CGCs in porcine FGOs (asterisk).

