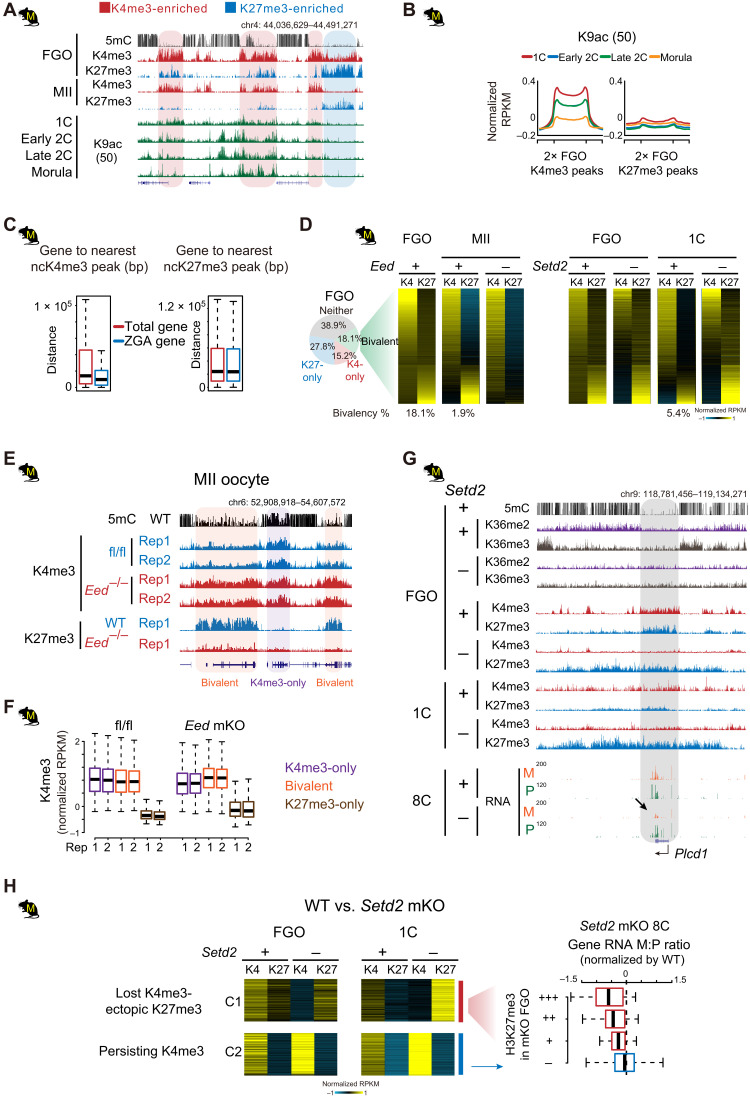
Fig. 7. Oocyte ncH3K27me3 is excluded from ncH3K4me3 domains in rodents.
(A and B) H3K9ac levels (50) at oocyte H3K4me3 or H3K27me3 domains in mouse embryos shown for an example locus (A) or meta-analysis (B). (C) Boxplots showing the distance of total genes and ZGA genes to the nearest ncH3K4me3 or ncH3K27me3 domains in mouse oocytes. (D) Left: Piechart showing the percentage of H3K27me3-only, H3K4me3-only, and bivalent bins in mouse FGOs. Middle right: Heatmaps showing the dynamics of H3K4me3 and H3K27me3 in bivalent domains (identified in FGOs) from FGO to one-cell in WT and Eed or Setd2 mKO mutants [data from (9)]. The percentages of bivalent bins at each stage in controls are also shown below. (E and F) Snapshots (E) and boxplots (F) showing the invasion of H3K4me3 to H3K27me3 marked regions in Eed mKO MII oocytes. H3K27me3 data in Eed mKO are from (80). (G) Aberrant spreading of H3K27me3 and the concomitant down-regulated maternal RNA reads at Plcd1 (arrow) in Setd2 mKO mutants. (H) Left: Heatmaps showing the spreading of H3K27me3 to H3K4me3-marked regions (5-kb bin) in Setd2 mKO FGOs and one-cell embryos [cluster 1 (C1)]. Right: Boxplot showing the maternal-to-paternal read count ratio (M:P) in Setd2 mKO eight-cell mutants (normalized by ratios in WT). Genes in C1 are classed into three groups according to the level of H3K27me3 (red) in Setd2 mKO FGOs. Genes in C2 that are marked by H3K4me3, but with no H3K27me3 spreading after Setd2 depletion, are similarly analyzed as control (blue). Setd2 mutant eight-cell embryos are derived from enucleated WT oocytes transferred with Setd2 mKO chromatin (9).

