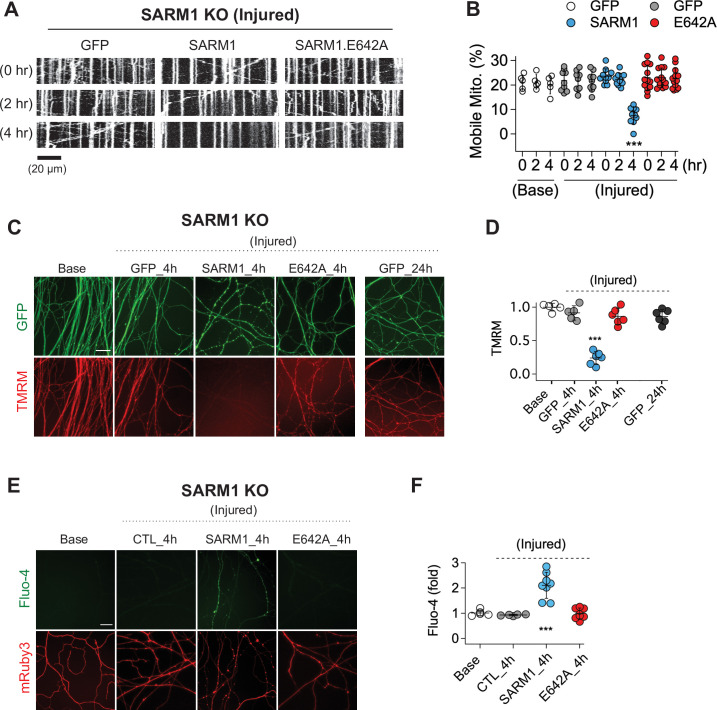
Figure 1. SARM1 enzymatic activity regulates mitochondrial movement and calcium homeostasis in injured axons.
(A) Representative kymograph of injured SARM1 KO axons expressing either GFP, SARM1, or SARM1.E642A (E642A). For imaging mitochondria movement, MitoDsRed lentivirus was transduced in all experimental conditions. Live cell imaging was performed at different times (0, 2, or 4 hr) after axon injury. Scale bar = 20 µm (B) Quantification of mobile mitochondria for the neurons in (A). Data represent the mean ± SEM; n = 5 ~ 13 axons for each condition; one-way ANOVA with post hoc Tukey test, F(11,99) = 12.28, p < 0.0001; NS, not significant; *, p < 0.05; **, p < 0.01 and ***, p < 0.001 (C) Representative images of mitochondrial potential imaged with 50 nM TMRM fluorescent dye in SARM1 KO axons expressing either of GFP, SARM1, or SARM1.E642A. Live-cell imaging was performed at the indicated times (0, 4, or 24 hr) after axon injury. Scale bar = 30 µm (D) Quantification of TMRM intensity from the experiment in (C). Injured SARM1 KO axons expressing the enzymatically disabled SARM1 mutant (E642A) maintained TMRM signal without significant loss. Data represent the mean ± SEM; n = 5 ~ 6 embryos for each condition; one-way ANOVA with post hoc Tukey test, F(4,23) = 53.11, p < 0.0001; NS, not significant; *, p < 0.05; **, p < 0.01 and ***, p < 0.001 (E) Representative images of calcium influx imaged with 1 µM Fluo-4 fluorescent dye in SARM1 KO axons expressing either of GFP, SARM1, or SARM1.E642A. Live-cell imaging was performed at different times (0, or 4 hr) after axon injury. Scale bar = 30 µm (F) Quantification of Fluo-4 intensity from the experiment in (E). Injured SARM1 KO axons expressing the enzymatically disabled SARM1 mutant (E642A) completely prevent calcium influx. Data represent the mean ± SEM; n = 5 ~ 8 embryos for each condition; one-way ANOVA with post hoc Tukey test, F(3,22) = 23.05, p < 0.0001; NS, not significant; *, p < 0.05; **, p < 0.01 and ***, p < 0.001.


