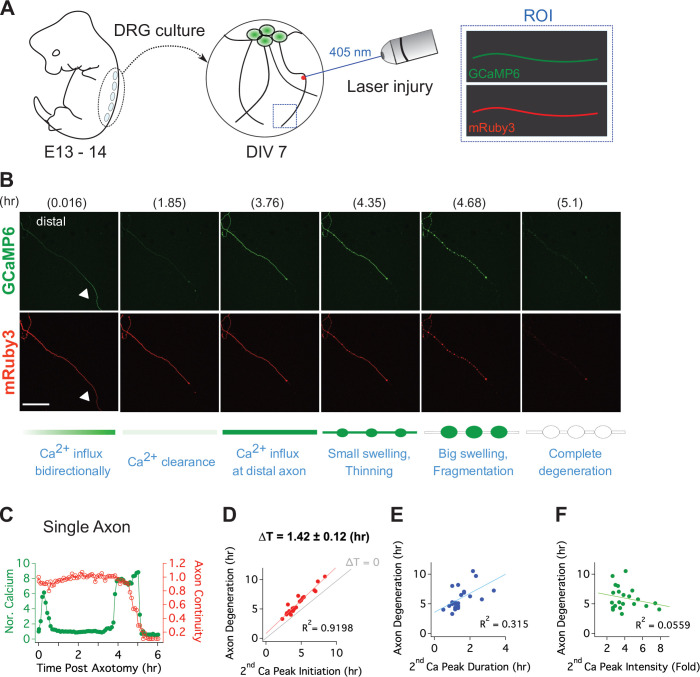
Figure 3. Live single axon imaging enables temporal dissection of cellular events in injured axons.
(A) Schematic diagram of laser axotomy in cultured embryonic DRG neurons. GCaMP6 and mRuby3 were expressed to observe calcium fluctuations and axonal morphology. (B) Snapshots of an injured wild-type axon. Also see Video 1. Progression of axon degeneration is described at the bottom of the schematic. Note that there is both an early and late phase of calcium influx. The first peak of calcium occurs at the injury site (white triangle) before calcium levels return to normal. The second calcium peak persists until the axon degenerates. Scale bar = 100 µm (C) Representative analysis of a single injured axon. The calcium response (left y-axis) and measure of axon continuity (right y-axis) for a single axon is plotted over time after axonal injury. Note the two distinct calcium peaks.


