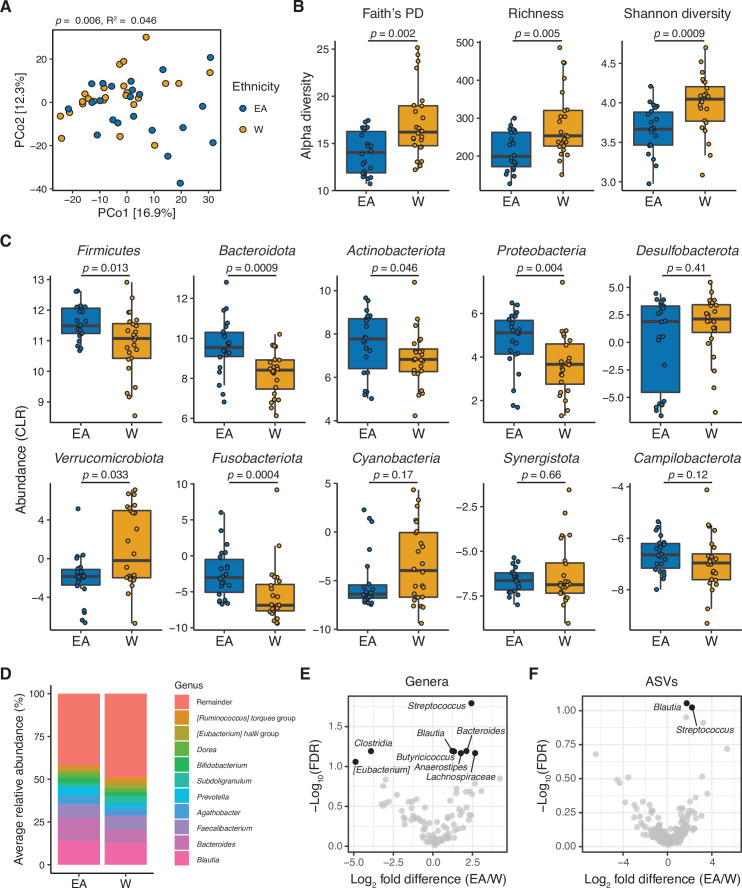
Figure 1. The gut microbiota is distinct between East Asian (EA) and White (W) subjects living in the Bay Area.
(A–C) Each point represents a single individual’s gut microbiota based upon 16S-seq. (A) Principal coordinate analysis of PhILR Euclidean distances reveals significant separation between ethnic groups (ADONIS test values shown). Additional distance calculations for complementary distance matrix calculations are shown in Supplementary file 1C. (B) Calculations of alpha diversity between EA and W subjects. p-values determined using Wilcoxon rank-sum tests. (C) CLR abundances of all bacterial phyla between EA and W subjects. p-values determined using Wilcoxon rank-sum tests. (D) Stacked bar plots showing the average percent relative abundances at the genus level for EA and W subjects, respectively. The most abundant taxa are shown as differently colored bars, with lower abundance taxa grouped as a single bar (Remainder). (E, F) Volcano plot of ALDEx2 differential abundance testing on (E) genera and (F) ASVs detected by 16S-seq in the gut microbiotas of EA versus W individuals. Significantly different (FDR<0.1) features are highlighted in black and labeled by genus or the most specific taxonomic assignment. (A–F) n=22 EA and n=24 W individuals. ASV, amplicon sequence variant; FDR, false discovery rate.


