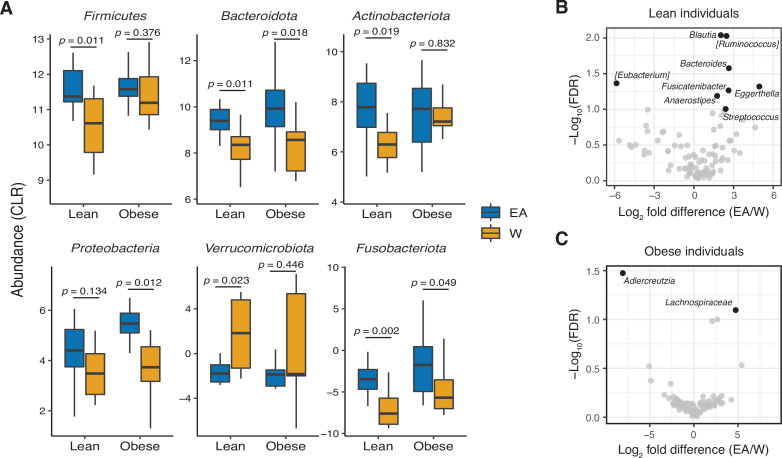
Figure 5. Ethnicity-associated bacterial taxa in lean and obese individuals.
(A) 5/6 phyla that were differentially abundant between ethnicities (see Figure 1C) were also significantly different between lean EA and W individuals. Three phyla were significantly different between obese EA and W individuals (p<0.05, Wilcoxon rank-sum test). (B, C) Volcano plot of ALDEx2 differential abundance testing on genera in stool microbiotas of lean (B) and obese (C) EA versus W individuals, with significantly different genera highlighted (FDR<0.1, ALDEx2). (A–C) n=12 EA lean, 10 EA obese, 11 W lean, and 13 W obese individuals. Data reflects 16S-seq. EA, East Asian; FDR, false discovery rate; W, White.

